Aggregate stats and load
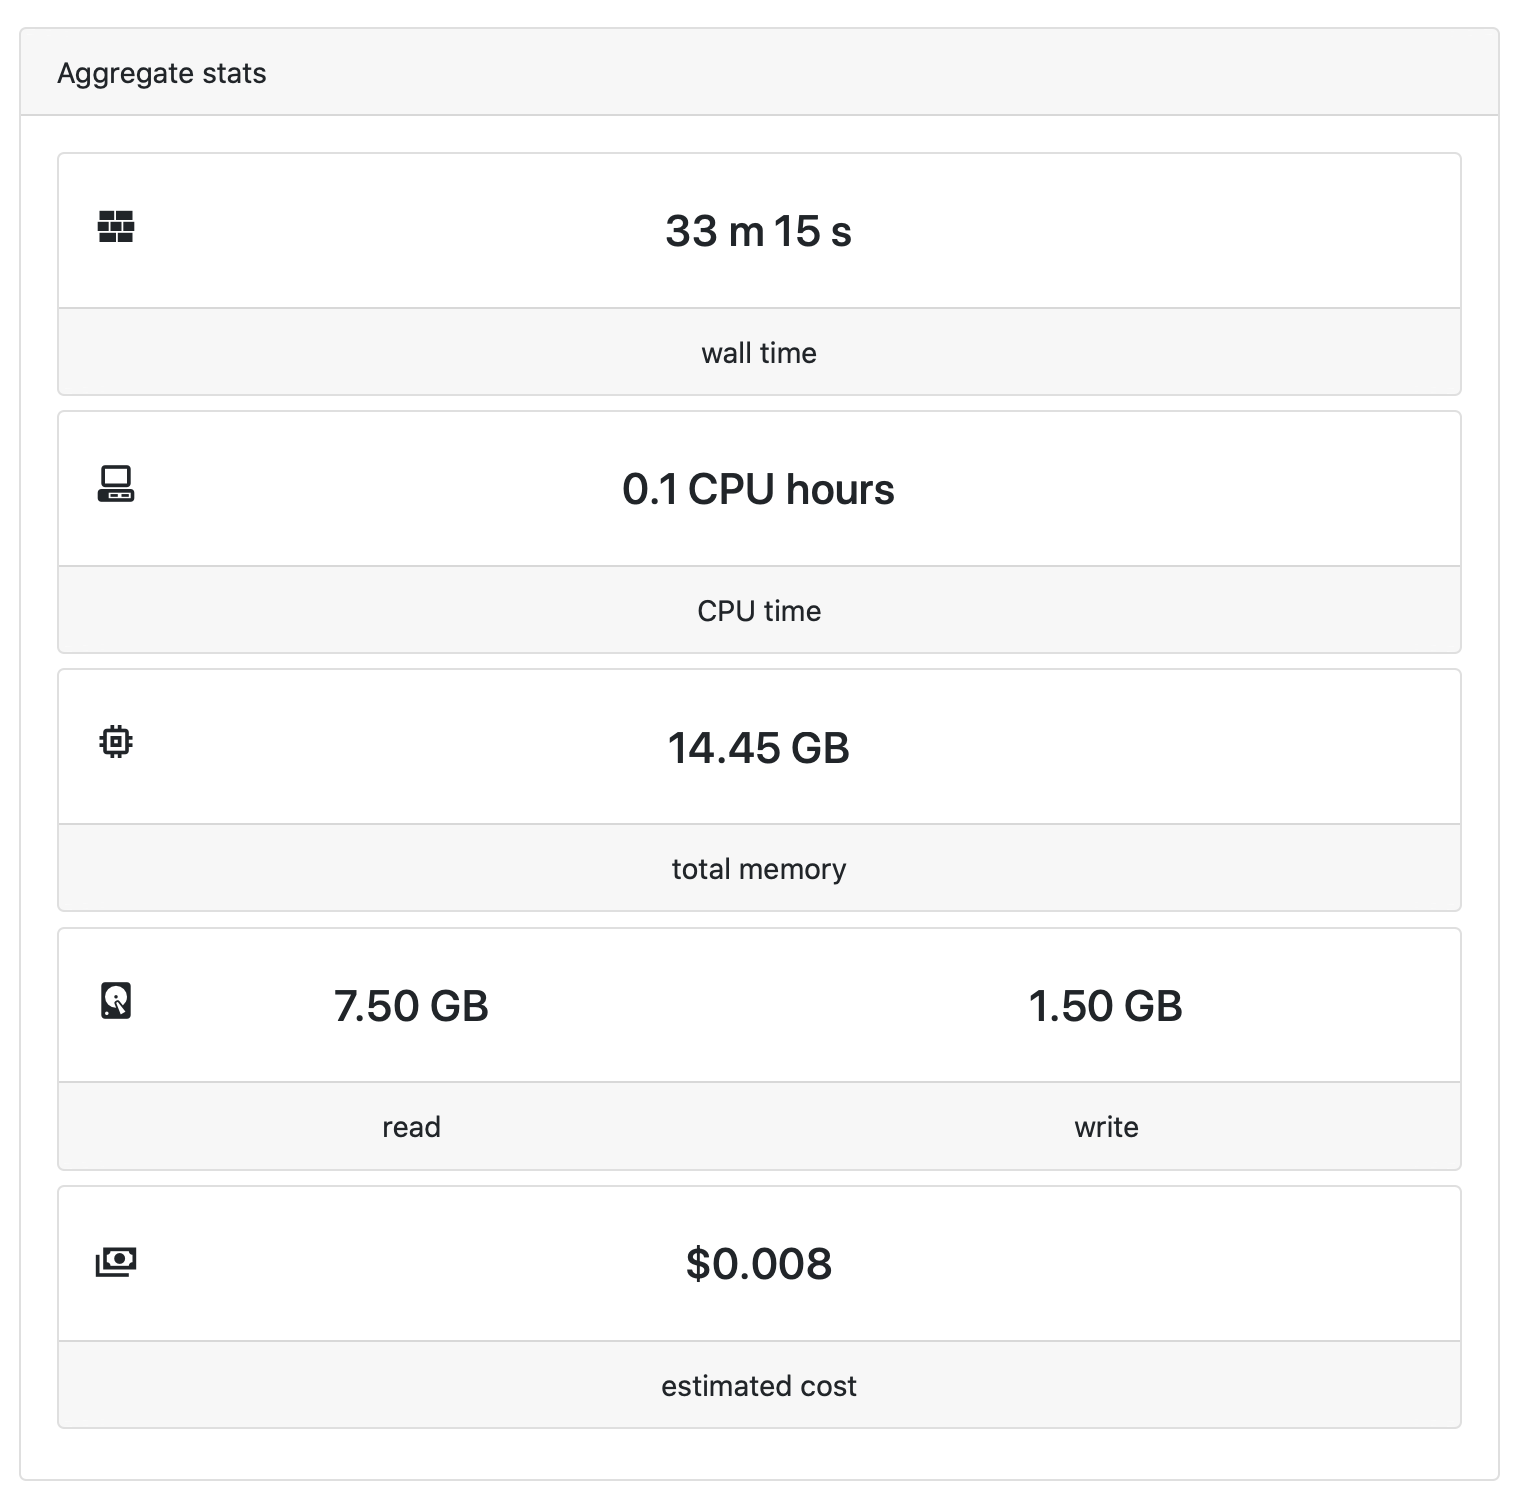
The Aggregate stats panel displays a real-time summary of the resources used by the workflow. These include total running time ('wall time'), aggregated CPU time (CPU hours), memory usage (GB hours), data i/o and cost.
Estimated cost
The estimated cost estimates the total compute cost of all tasks in the workflow run. The compute cost of a task is calculated as follows:
Tower uses a database of prices for AWS and Google Cloud, accross all instance types, regions, and zones, to fetch the VM price for each task. This database is updated periodically to reflect the most recent prices.
Prior to Tower Enterprise 22.4.x, the cost estimate used realtime instead of complete and start to measure the task runtime. The realtime metric tends to underestimate the billable runtime because it doesn't include the time required to stage input and output files.
The estimated cost is subject to several limitations:
-
It does not account for the cost of storage, network, the head job, or how tasks are mapped to VMs. As a result, it tends to underestimate the true cost of a workflow run.
-
On a resumed workflow run, the cost of cached tasks is included in the estimated cost. As a result, the total cost of multiple attempts of a workflow run tends to overestimate the actual cost, because the cost of cached tasks may be counted multiple times.
For accurate cost accounting, you should use the cost reporting tools for your cloud provider (such as AWS Cost Explorer). You can use Resource labels in your compute environments to annotate and track the actual cloud resources consumed by a workflow run.
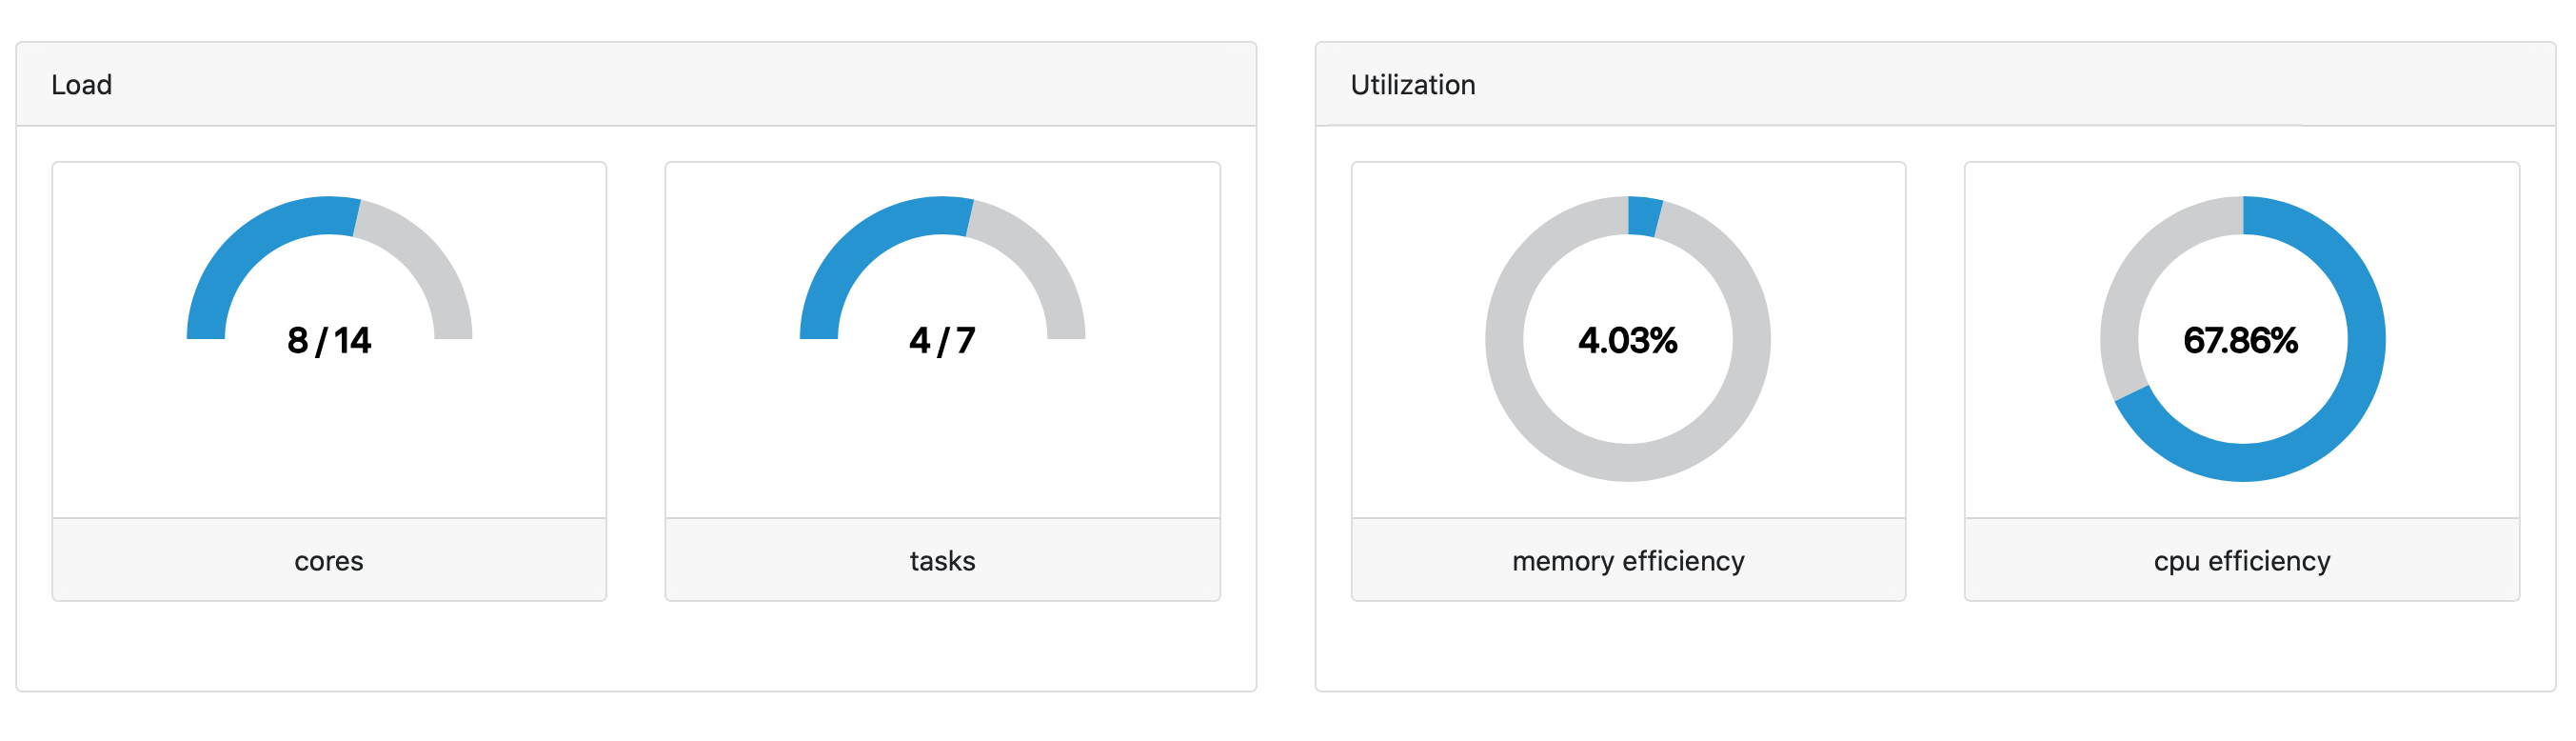
Load and Utilization
As processes are being submitted to the compute environment, the Load monitors how many cores and tasks are currently being used. For the cores gauge chart, the denominator is the maximum number of cores that have already been used at that moment during the execution of that specific pipeline.
Utilization is calculated for memory and CPUs. This is the average value across all tasks and is calculated by dividing the memory (or CPUs) usage by the memory (or CPUs) requested.