Dashboard Overview
Overview
This feature is available from Tower v.22.3.
The Tower Dashboard provides an overview of runs in your organizations and personal workspace at a glance. Access it from the user top-right menu, under Dashboard.
Filters and summary

The Dashboard view defaults to all organizations and workspaces you can access. Select the drop-down next to View: to filter by specific organizations and workspaces, or to view statistics for your personal workspace only.
The filter button provides options for filtering by time, including a custom date range of up to 12 months. The button icon and color changes to indicate when a filter has been applied to your dashboard view.
Below the filters, a summary of total runs is shown by status.
Export data
Select Export data in the filter panel near the top of the page to download a CSV file of your dashboard data. The export contains data based on the filters you have applied.
Runs per organization
Below the cards displaying total runs by status, run totals for your selected filters above are displayed.
Depending on the filter selected, each card details a separate workspace or organization. Total runs for each organization are arranged by workspace and status.
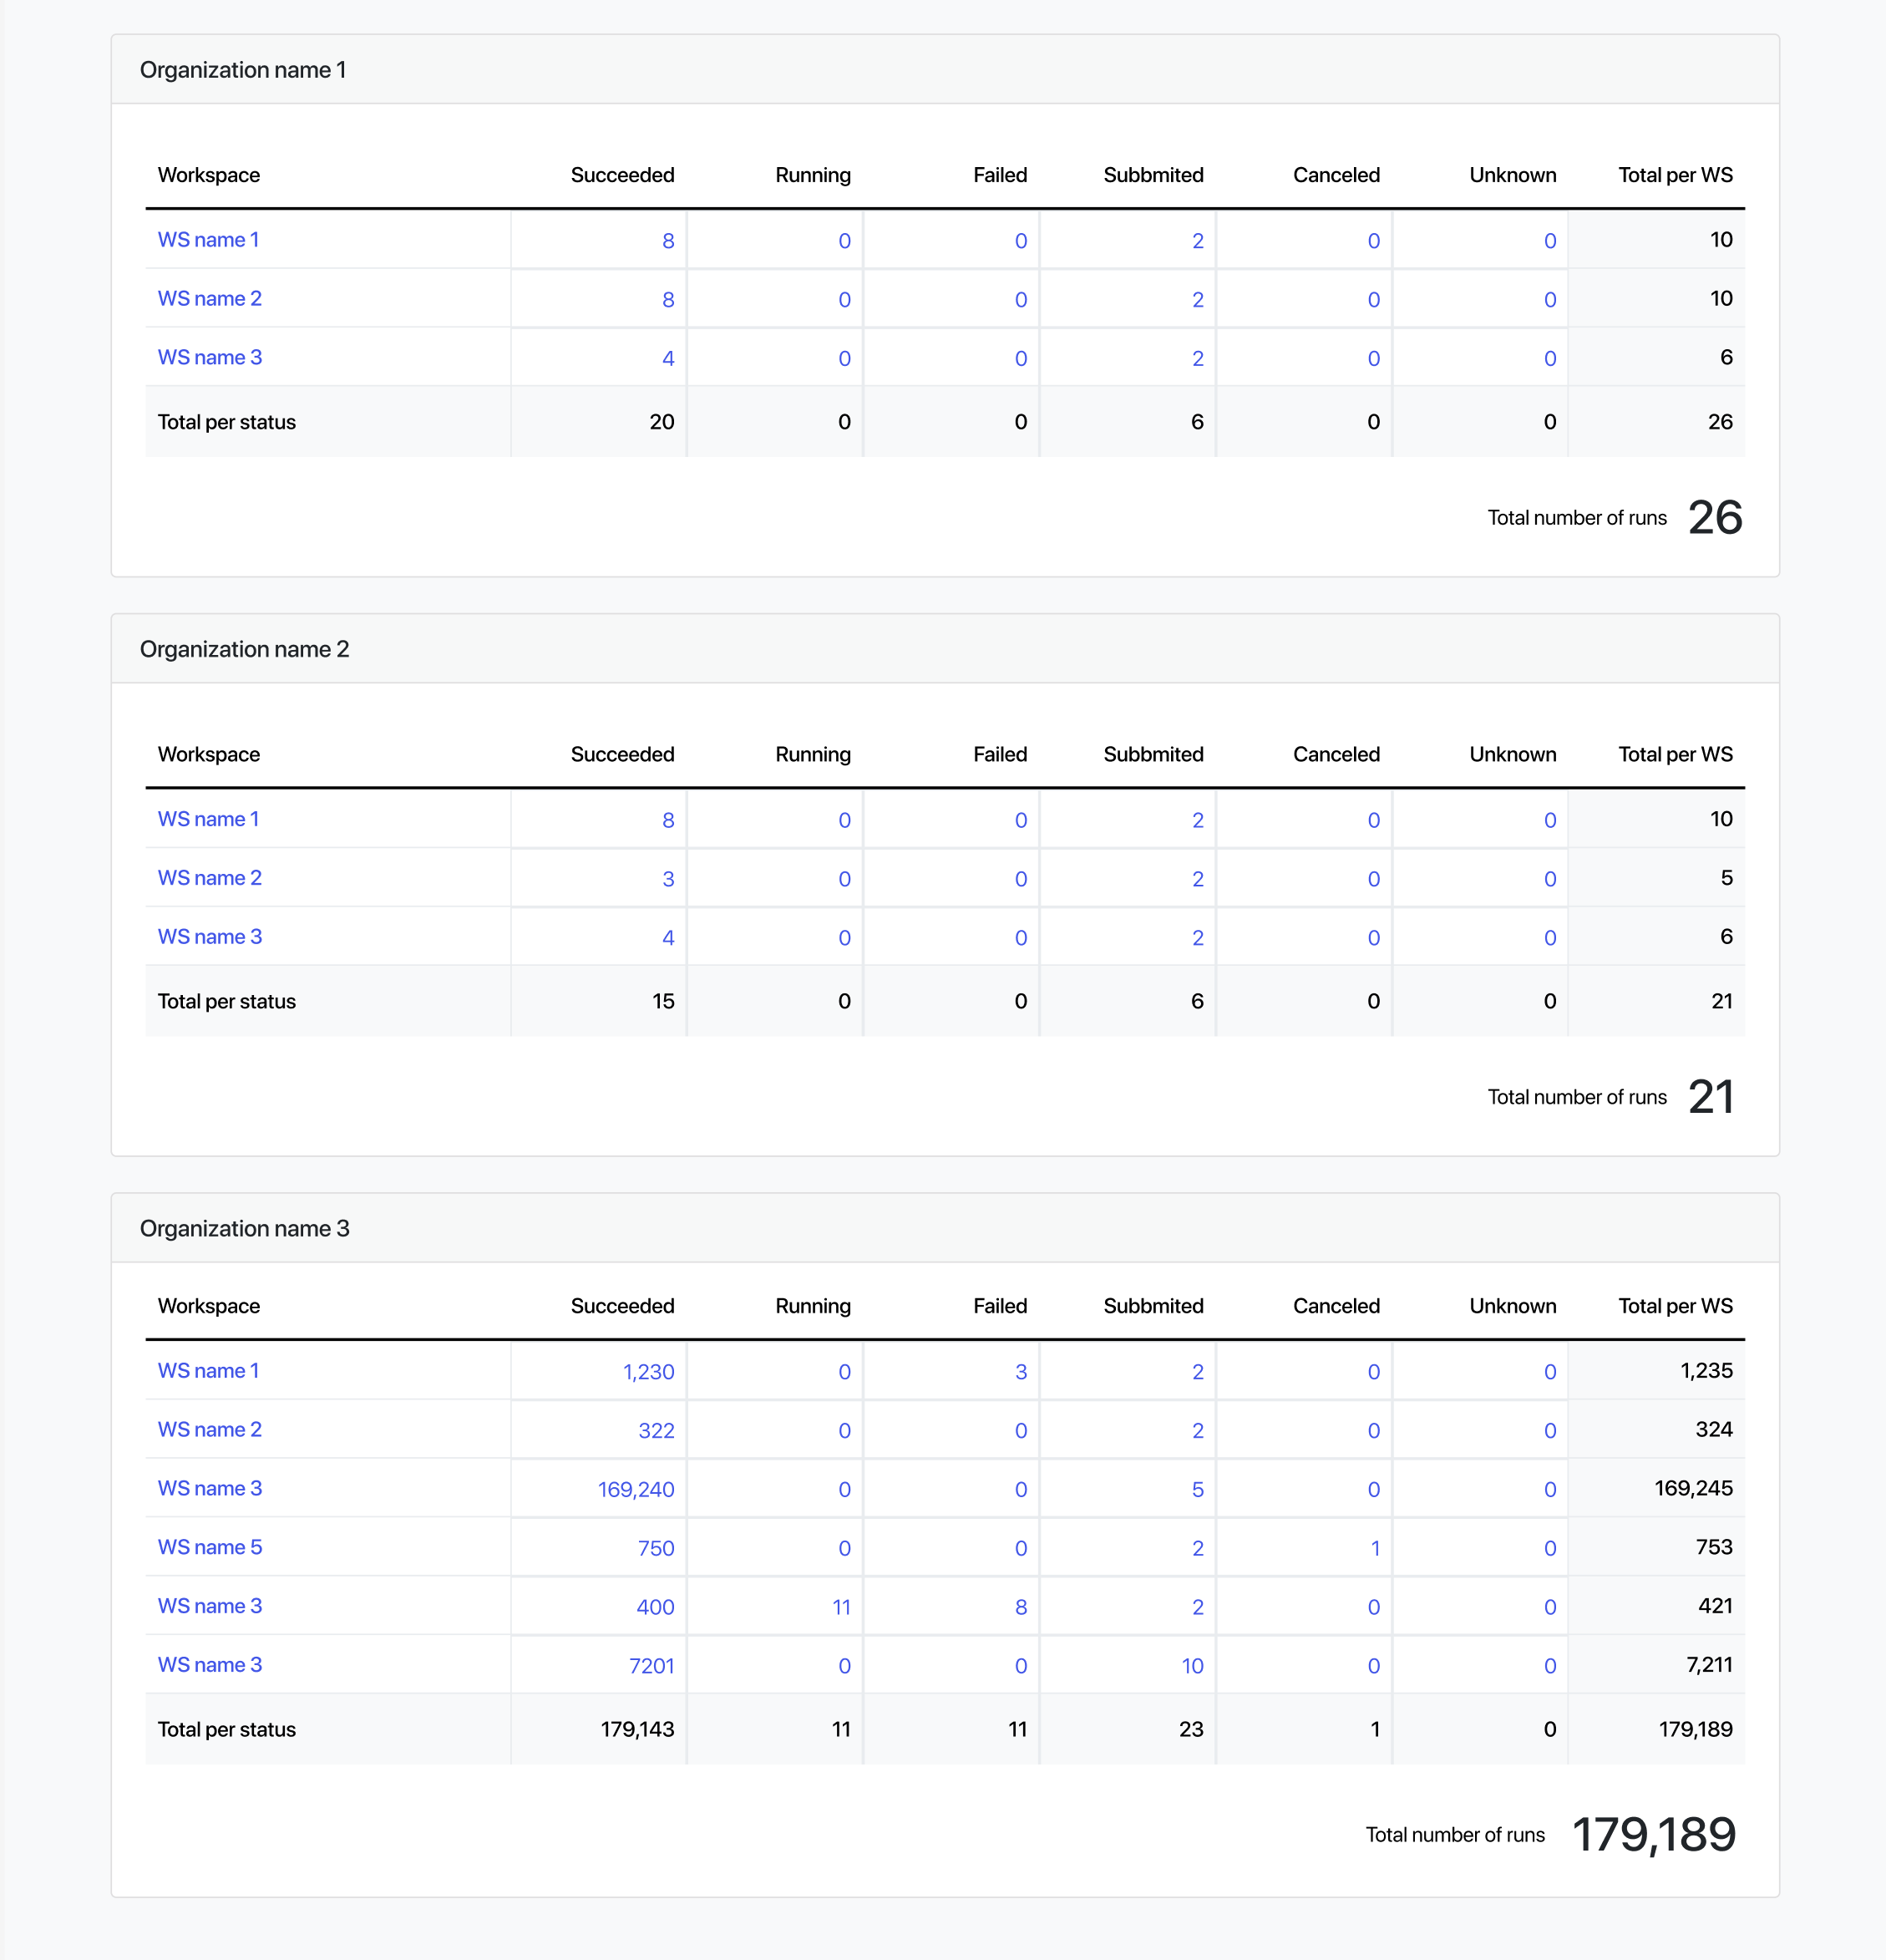
Select a run value in the table to navigate to a run list filtered by the status and time range selected.
Select a workspace name in the table to navigate to a run list filtered by the workspace selected.