
Run details
Select a workflow run from the Runs list to open a run details page.
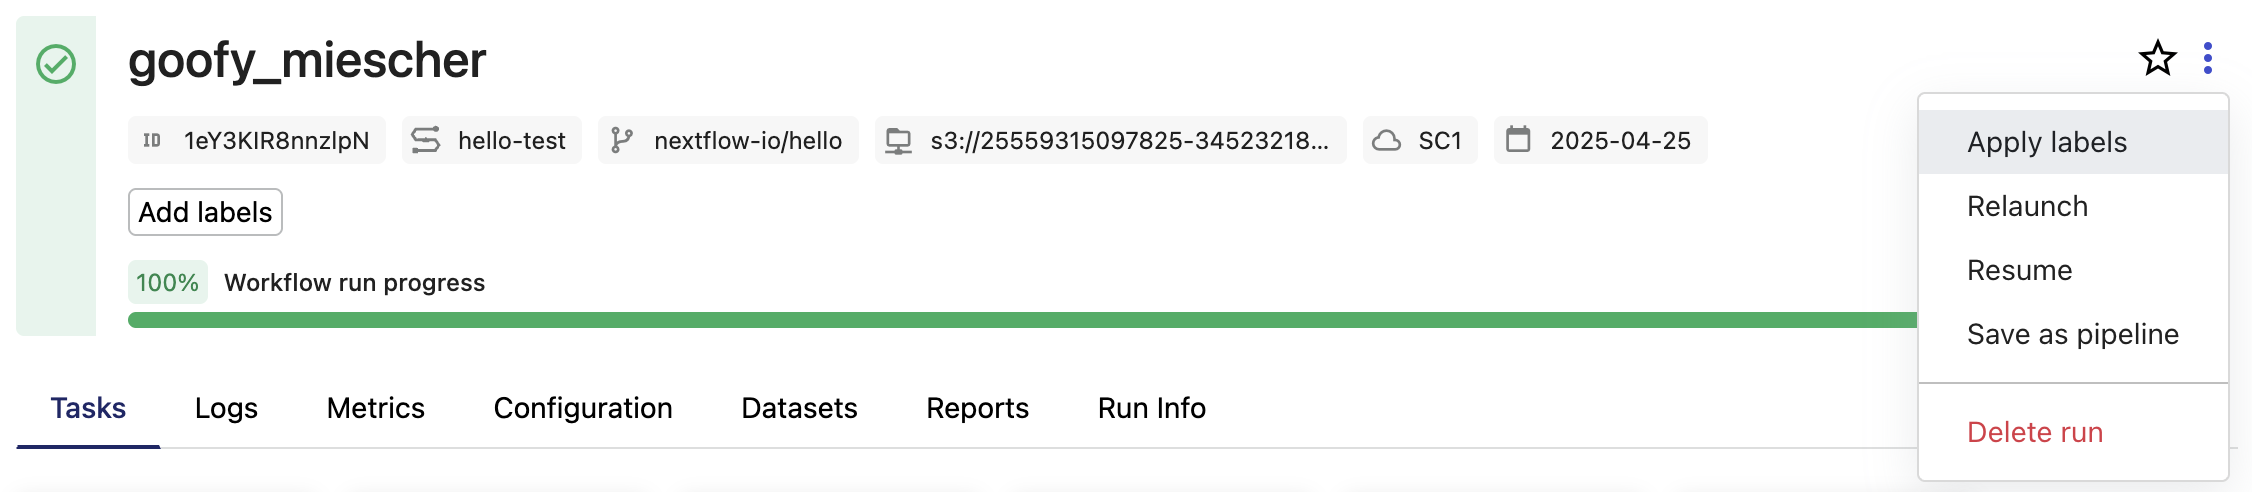
The top of the page contains basic run details and a progress overview for an at-a-glance view of the run's status:
- View and copy the run ID, pipeline name and repository, pipeline work directory, compute environment, and launch date.
- Select the star icon to favorite the run and find it more easily via a filter view in the runs list later.
- Use the options menu to apply labels, relaunch, resume, or delete the run, or to save the run as a new pipeline.
Select the tabs below the workflow run progress bar to view further run details:
- Tasks: View the status and progress of pipeline tasks and processes, including extensive task details
- Logs: View and download the pipeline run's execution logs
- Metrics: View resource metrics for the run
- Configuration: View Nextflow configuration files and the resolved configuration used for the run
- Datasets: View datasets used as input for the run, if any
- Reports: View reports for the run, if any were configured
- Containers: View the details of containers used in the run, if any
- Run Info: View details about the run, infrastructure, and executor
- Tasks
- Logs
- Metrics
- Configuration
- Datasets
- Reports
- Containers
- Run Info
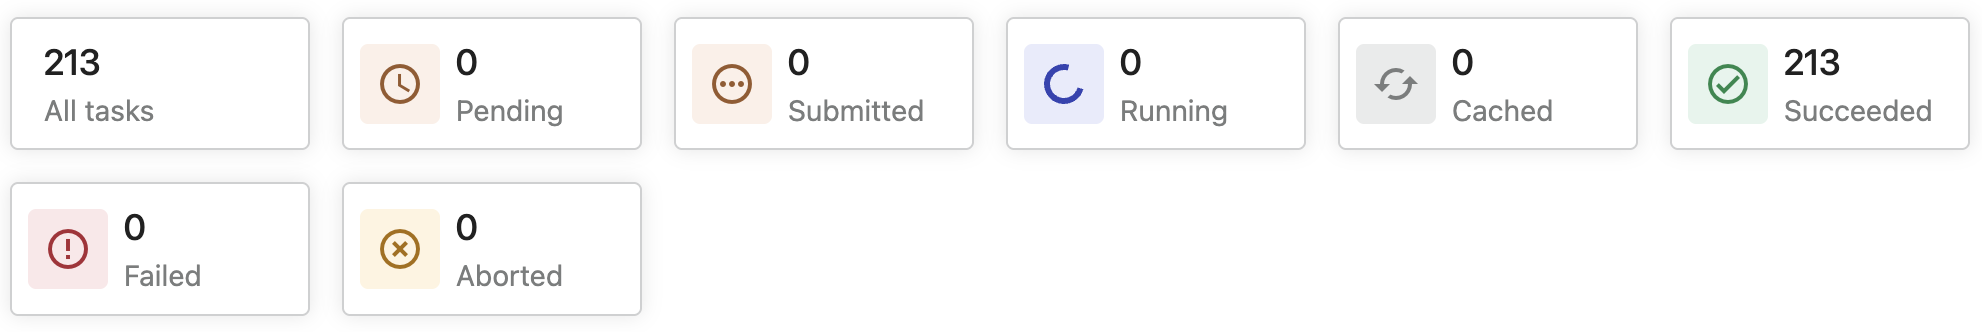
The cards at the top of the Tasks tab provide a real-time status of all tasks in the pipeline run:
- Pending: The task has been created, but not yet submitted to an executor
- Submitted: The task has been submitted to an executor, but is not yet running
- Running: The task has been launched by an executor (the precise definition of "running" may vary for each executor)
- Cached: A previous (and valid) execution of the task was found and used instead of executing the task again. See Cache and resume
- Succeeded: The task completed successfully
- Failed: The task failed
- Aborted: The task was submitted, but the run was cancelled or failed before the task could begin
Processes
The Processes panel displays the status of each process in a pipeline run. In Nextflow, a process is an individual step in a pipeline, while a task is a particular invocation of a process for given input data. In the panel, each process is shown with a progress bar indicating how many tasks have been completed for that process.
The progress bar is color-coded based on task status (created, submitted, completed, failed).
Select a process to navigate to the Tasks panel and filter the table contents by the selected process.
Tasks
The Tasks panel shows all the tasks that were executed in the run.
Use the search bar to filter tasks with substrings in the table columns such as process, tag, hash, and status. For example, if you enter succeeded in the Search task field, the table displays only tasks that succeeded.
Task details
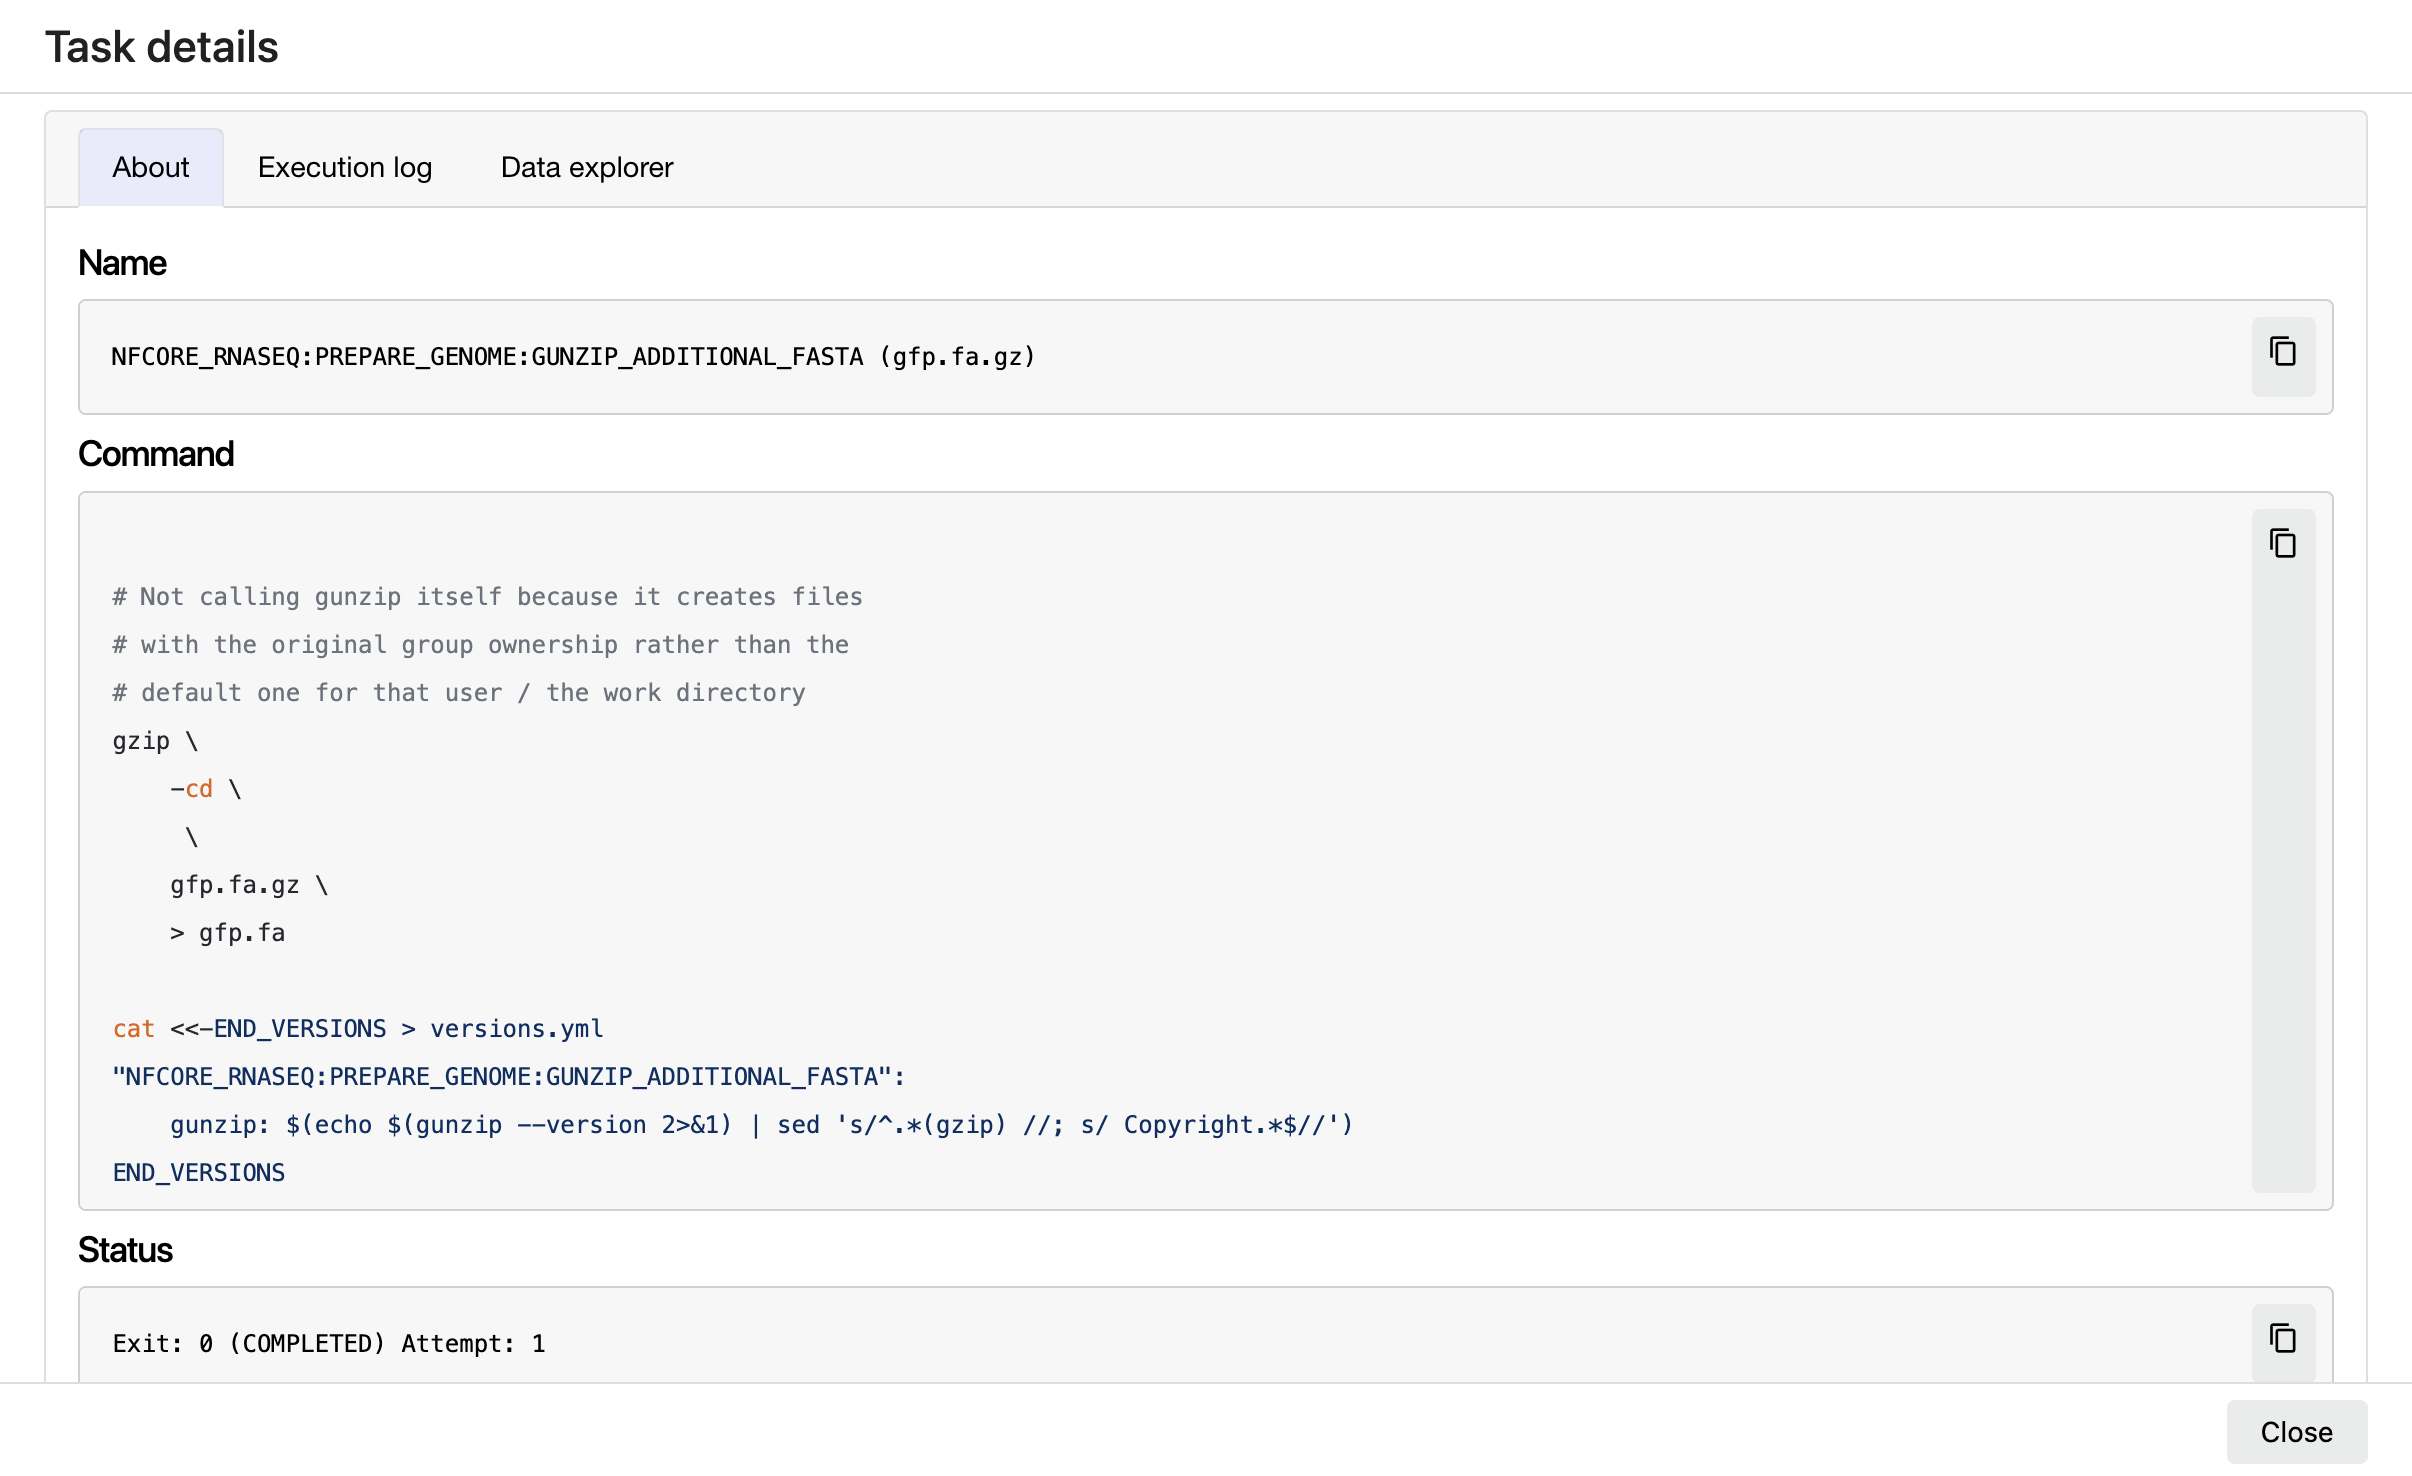
Select a task in the task table to open the Task details dialog. The dialog has three tabs:
-
About
- Name: Process name and tag
- Command: Task script, defined in the pipeline process
- Status: Exit code, task status, attempts
- Work directory: Directory where the task was executed
- Environment: Environment variables supplied to the task
- Execution time: Metrics for task submission, start, and completion time
- Resources requested: Metrics for the resources requested by the task
- Resources used: Metrics for the resources used by the task
-
Execution log
The Execution log tab provides a real-time log of the selected task's execution. Task execution and other logs (such as
stdoutandstderr) are available for download if they are still available in your compute environment. -
Data Explorer
If the pipeline work directory is in cloud storage, this tab shows a Data Explorer view of the task's work directory location with the files associated with the task.
The Logs tab contains a window with the Nextflow execution log console output. Select Download log files to download:
- Nextflow console output, in TXT format.
- Nextflow log file, in LOG format.
- Execution timeline graph, in HTML format.
The cards at the top of the Metrics tab display a real-time summary of the resources used by the run.

Wall time
Wall time is the duration of the entire workflow run, from submission to completion. While the run is in progress, wall time is a measure of the time elapsed since run start.
CPU time
CPU time is the total CPU time used by all tasks, measured in CPU hours. It is based on the CPUs requested, not the actual CPU usage. The CPU time of an individual task is computed as follows:
The runtime of an individual task is computed as follows:
See also: cpus, start, and complete in the task table.
Memory
Memory is the total memory used by all tasks. It is based on the memory requested, not the actual memory usage.
See also: peakRss in the task table.
Data read and write
Data read and Data write are the total amount of data (in GB) read from and written to storage.
See also: readBytes and writeBytes in the task table.
Estimated cost
An estimated cost for the run. See Seqera cost estimate for details.
Load
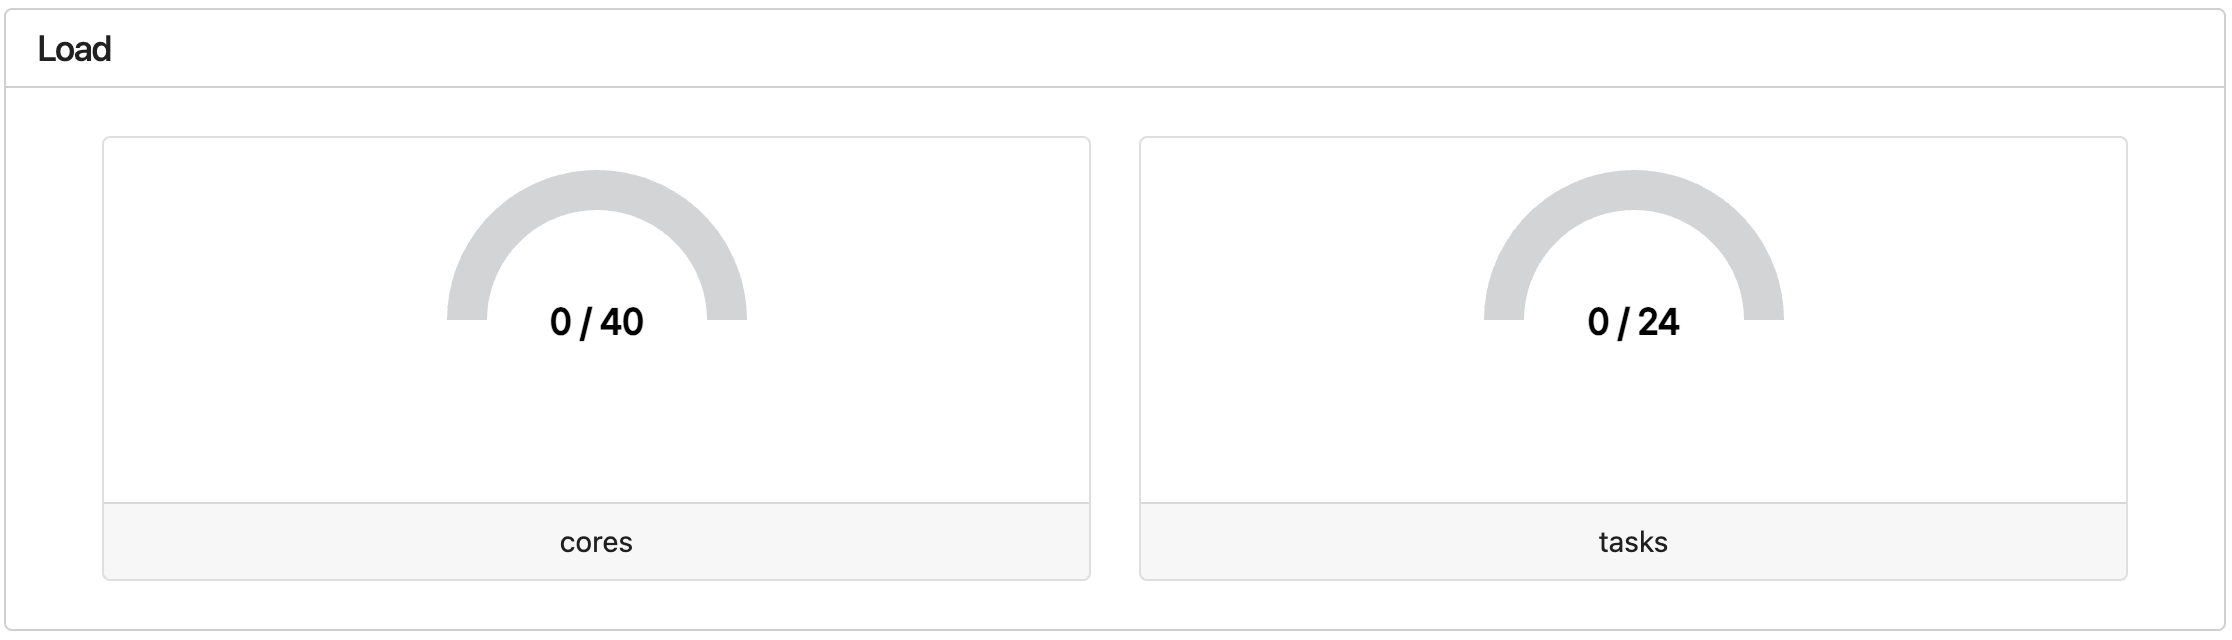
The Load panel displays the current number of running tasks and CPU cores vs the maximum number of tasks and CPU cores for the entire pipeline run.
These metrics measure the level of parallelism achieved by the pipeline. Use these metrics to determine whether your pipeline runs are fully utilizing the capacity of your compute environment.
Utilization
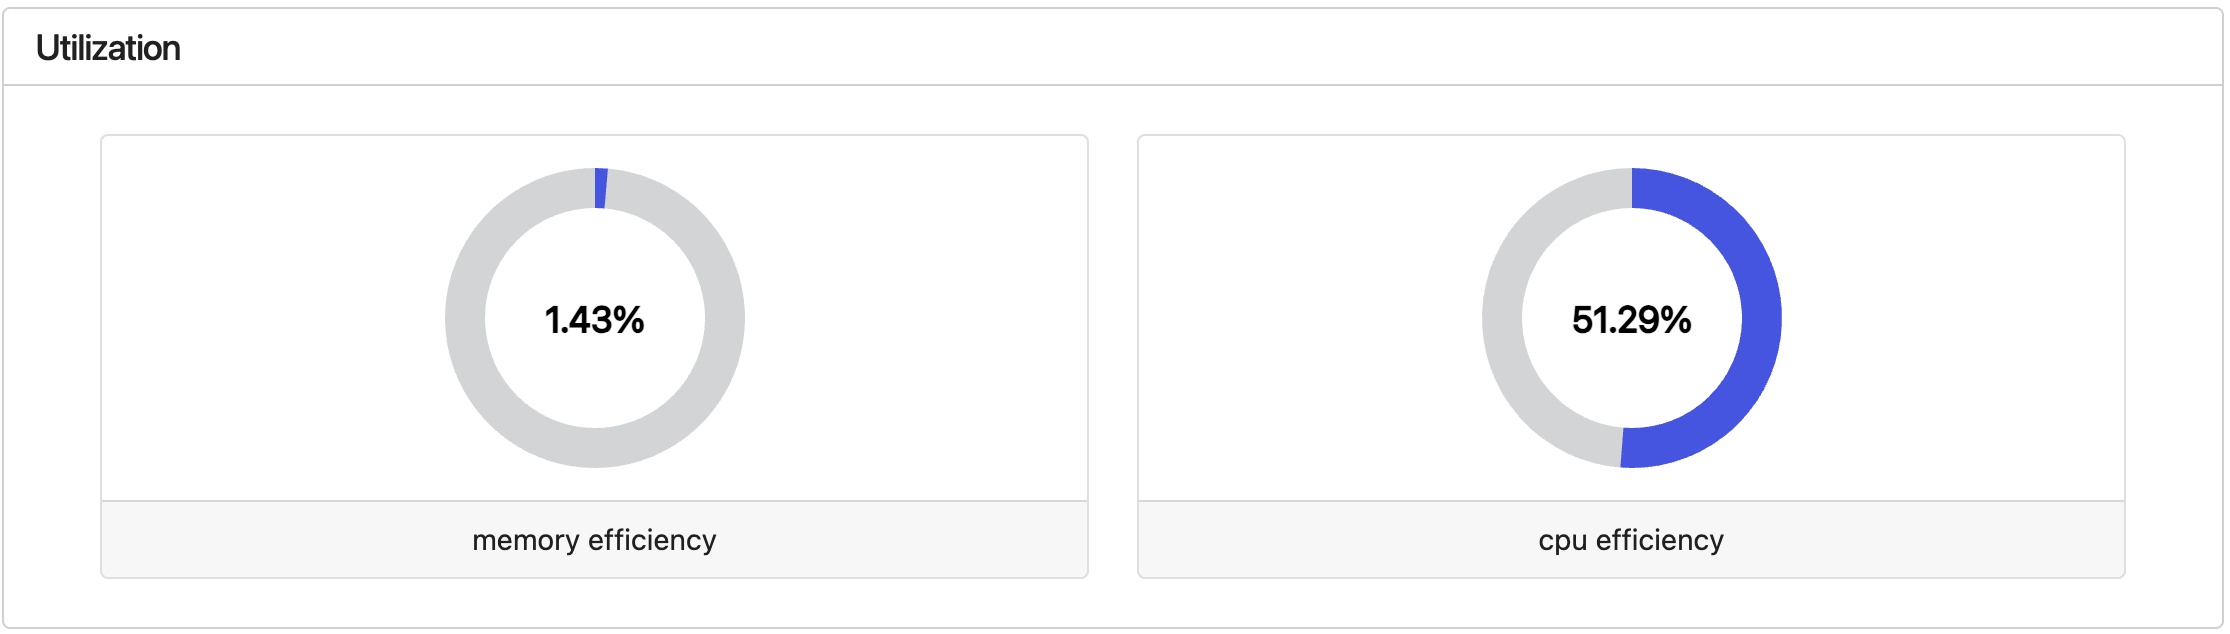
The Utilization panel displays the average resource utilization of all tasks that have completed successfully in a pipeline run. The CPU and memory efficiency of a task are computed as follows:
See also: pcpu, cpus, peakRss, and memory in the task table.
These metrics measure how efficiently the pipeline is using its compute resources. Low utilization indicates that the pipeline may be over-requesting resources for some tasks.
Interactive resource plots
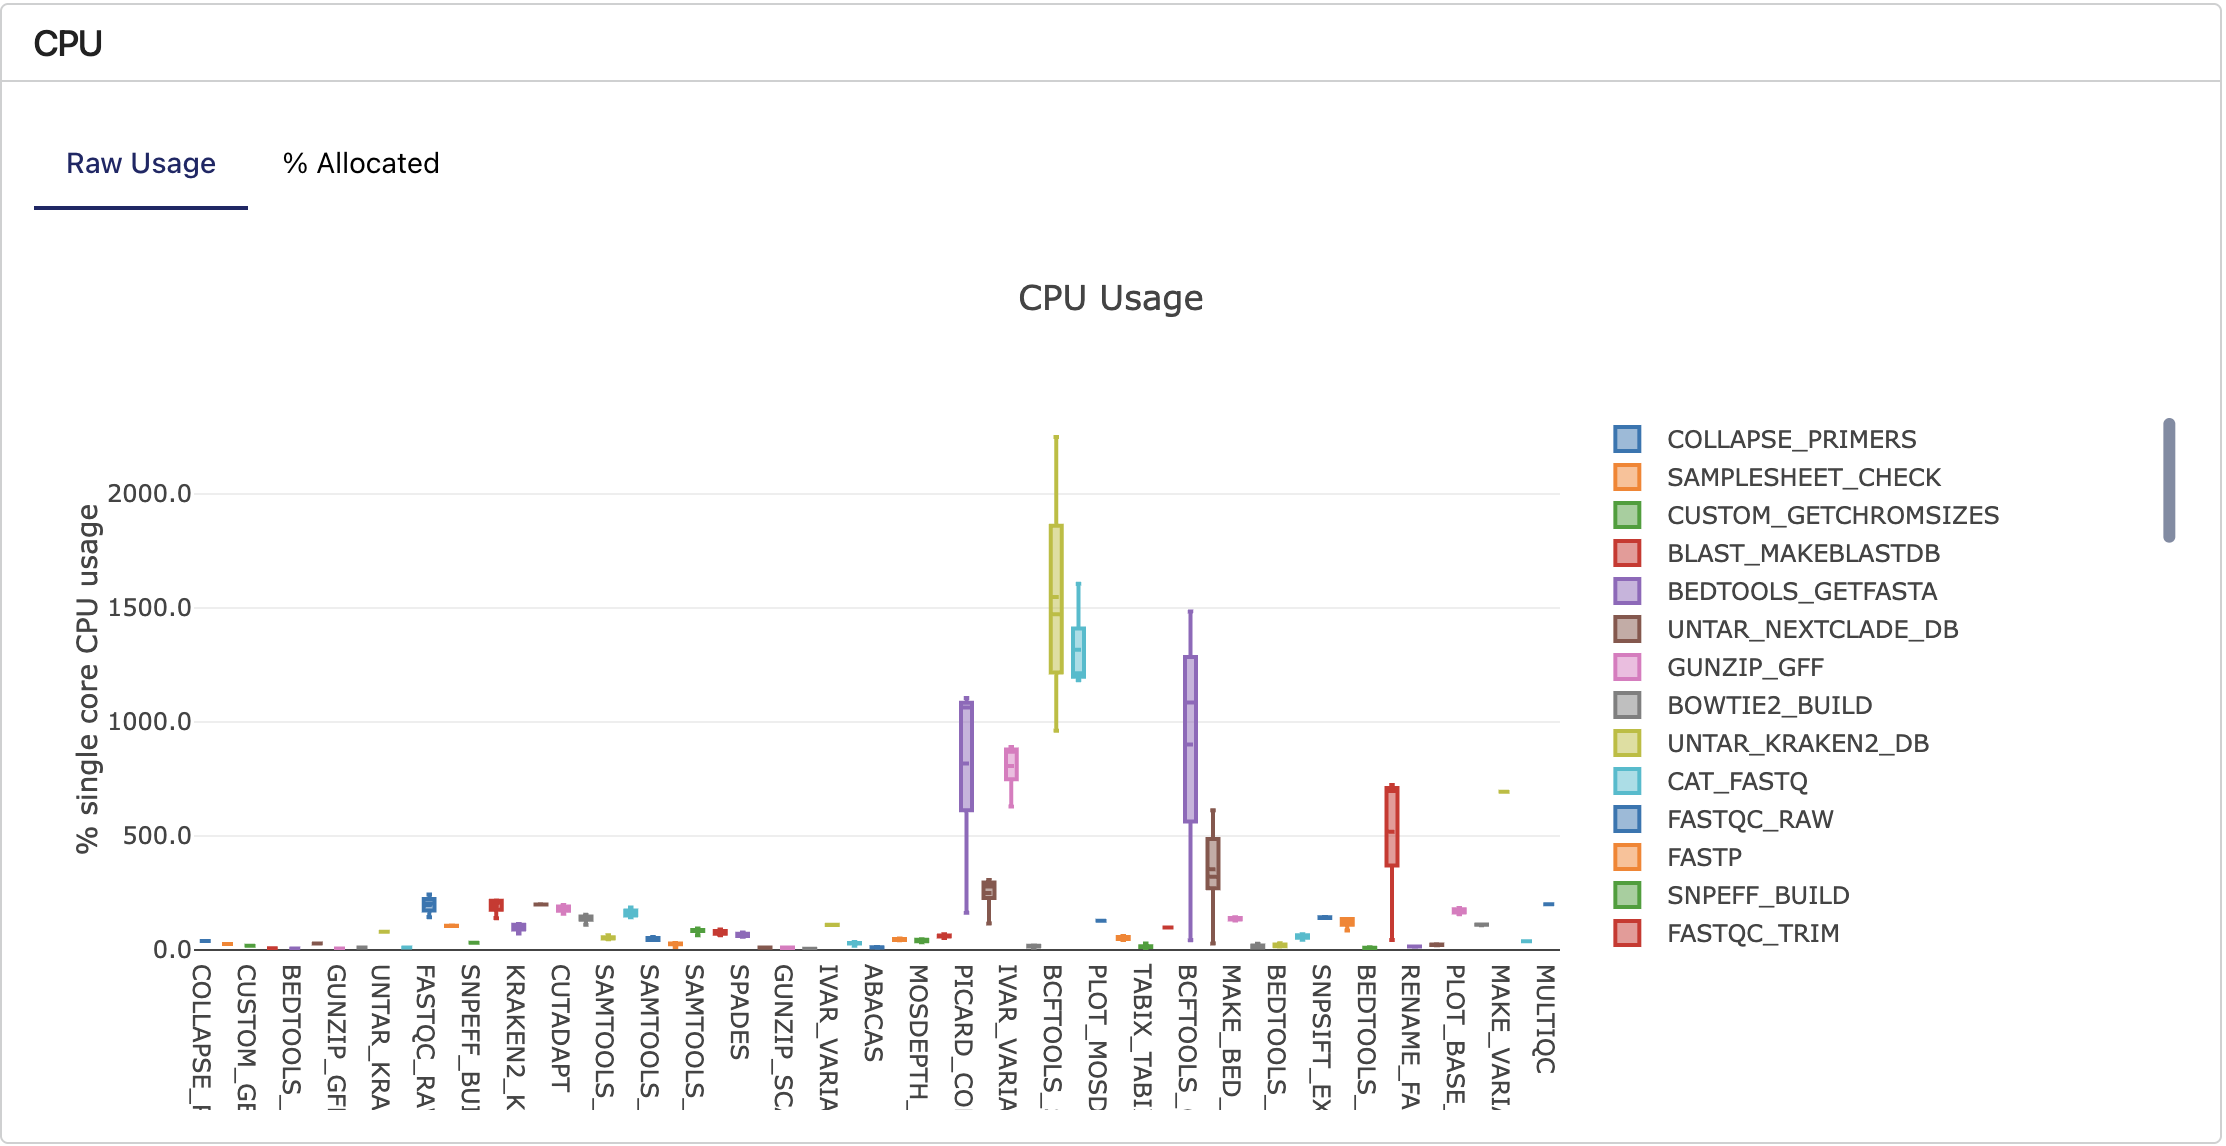
The CPU, Memory, Job duration, and I/O interactive plots visualize detailed resource usage, grouped by process. These metrics include succeeded and failed tasks. Use these plots to quickly inspect a pipeline run to determine the resources requested and consumed by each process.
Hover the cursor over each box plot to show more details.
The Configuration tab contains information about the pipeline parameters, Nextflow configuration, and Nextflow command used for the run.
Parameters
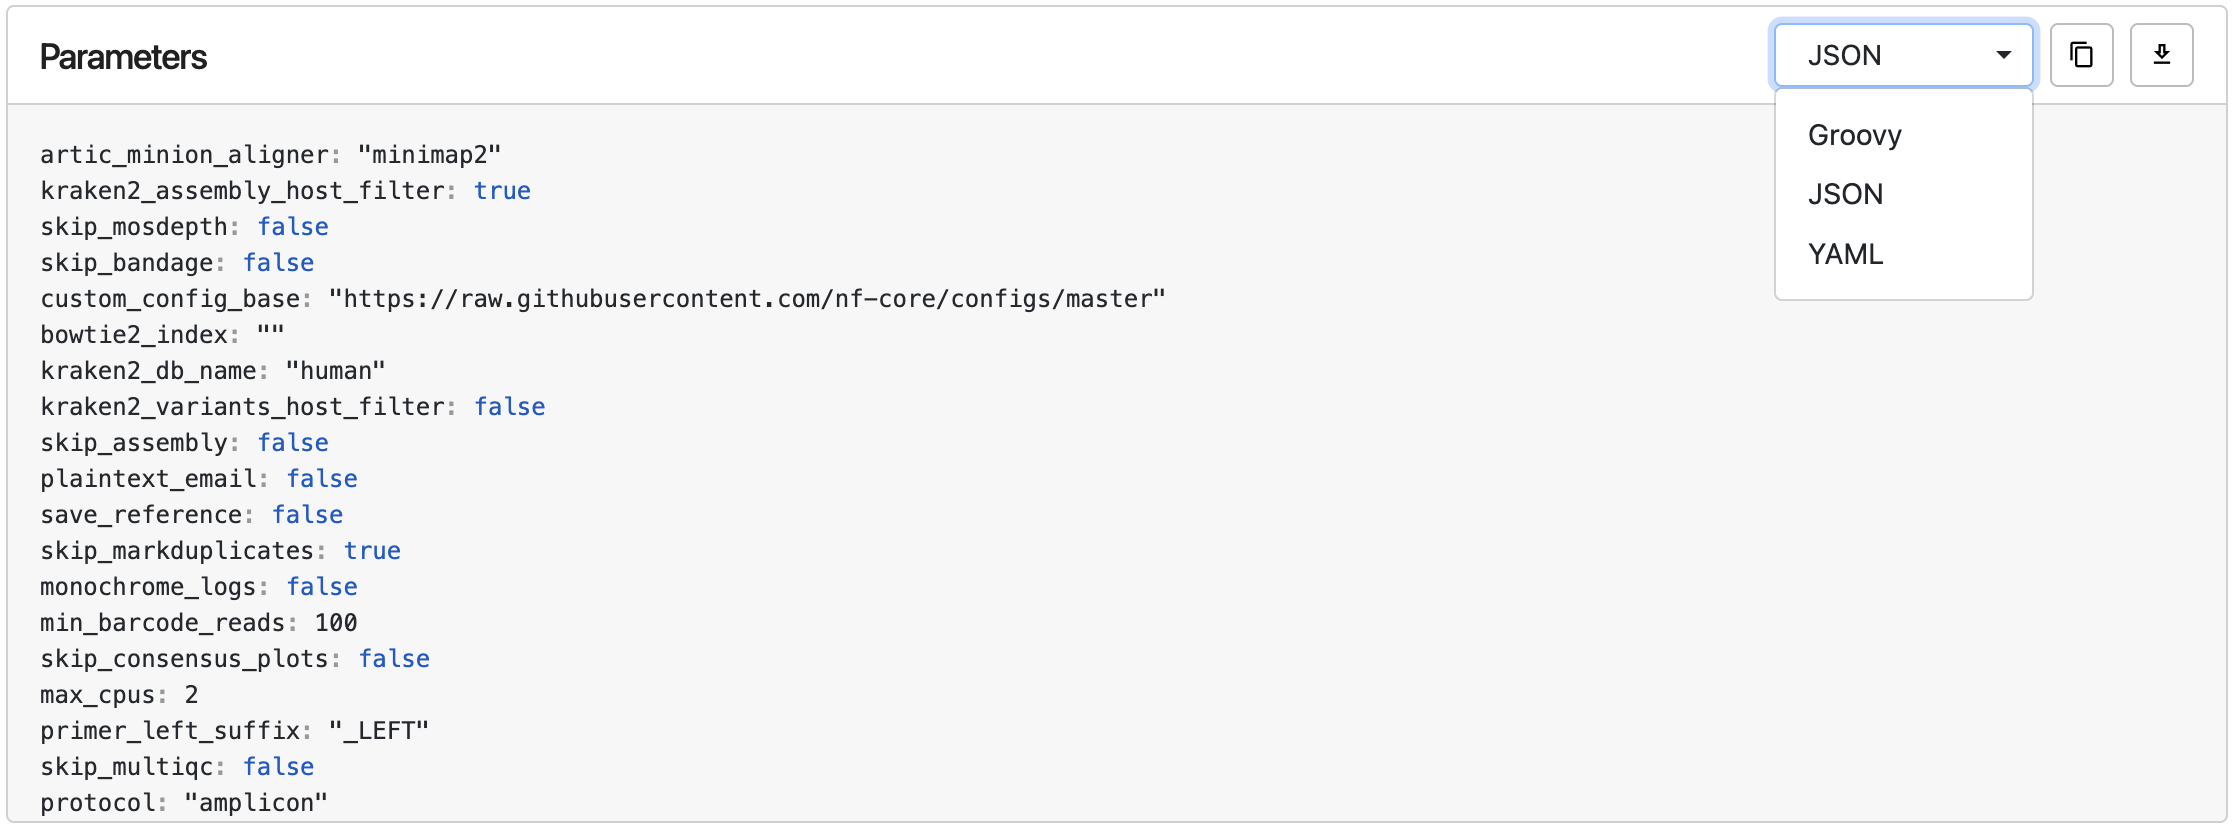
The Parameters window displays the pipeline parameters configured for the run, with options to view, copy, or download the parameters in Groovy, JSON, or YAML format.
Configuration
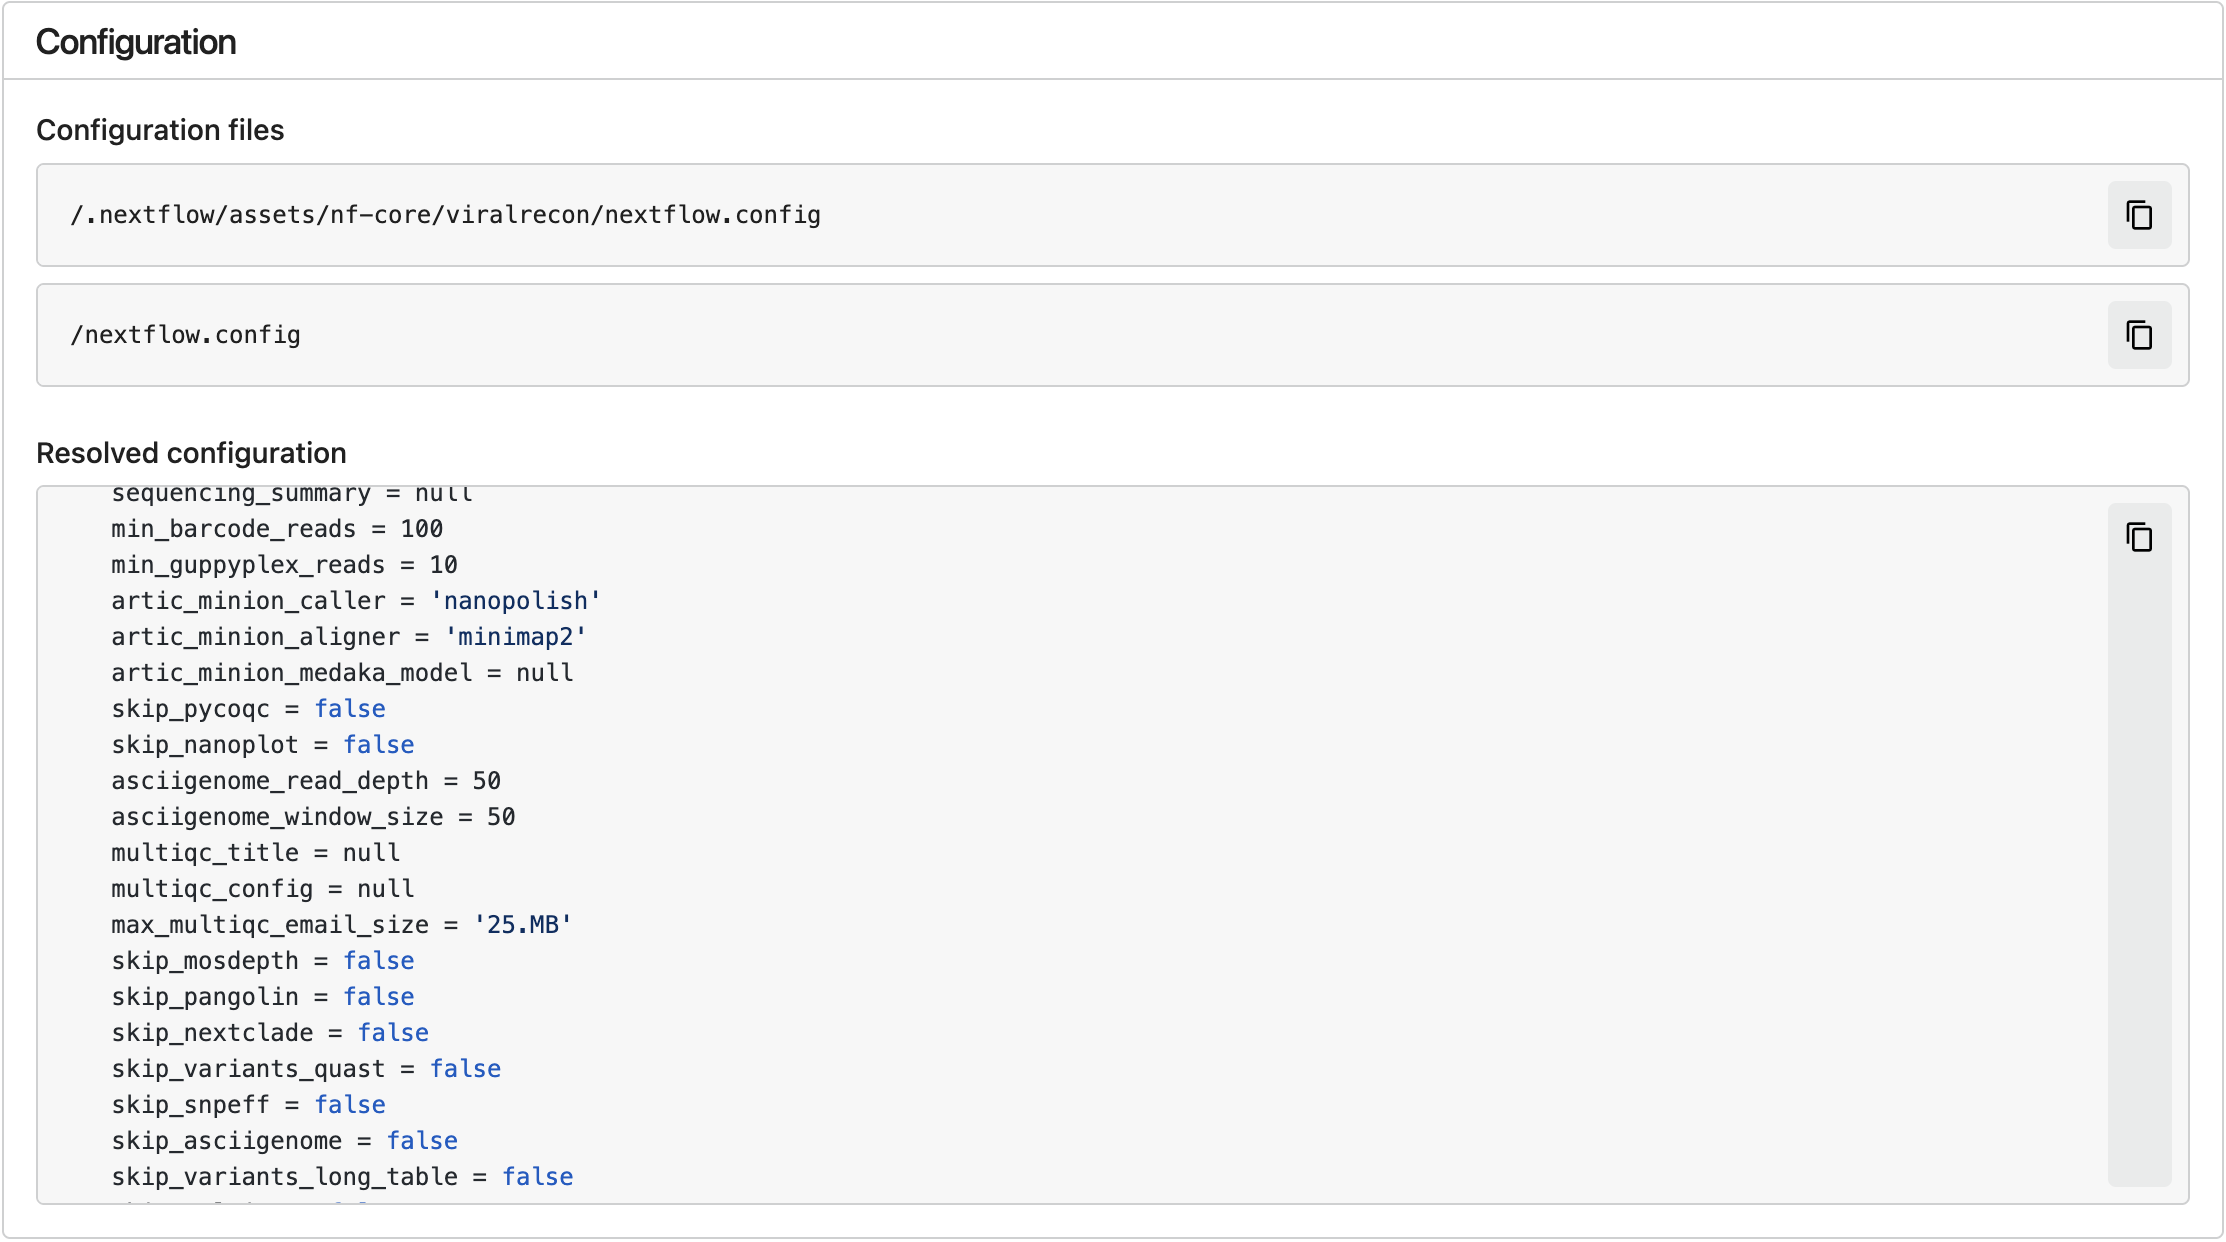
The Configuration window displays the locations of the Nextflow configuration files used for the run, and the resolved configuration resulting from those configuration files.
Command
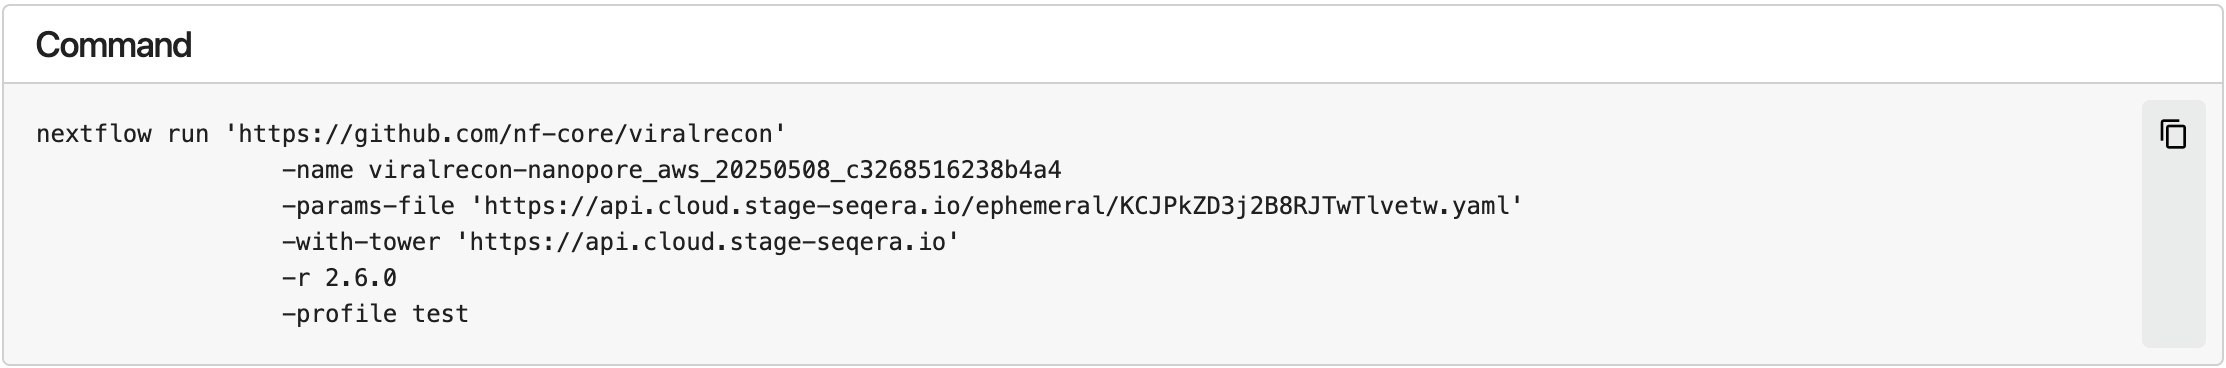
The Command window displays the Nextflow command used for the run.
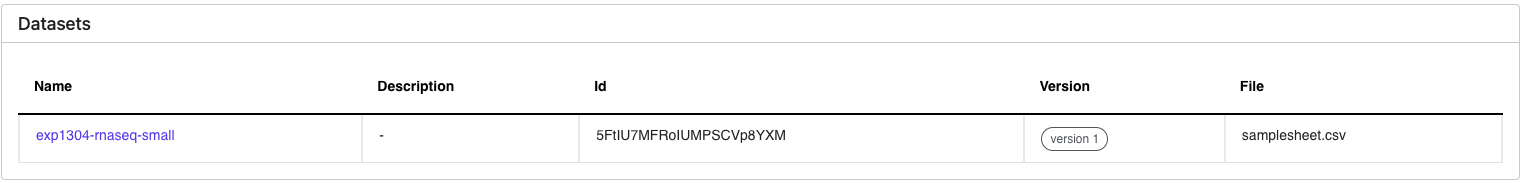
The Datasets tab displays information about the datasets used as input for the run. This view is empty if no datasets were selected.

The Reports tab contains a table with the names, details, and paths to all reports generated by the run, if any were configured. Select a report to open a Data Explorer file preview of the report, with options to open the report in a new tab or download it.
The containers feature is only available from Nextflow 25.03.1-edge.
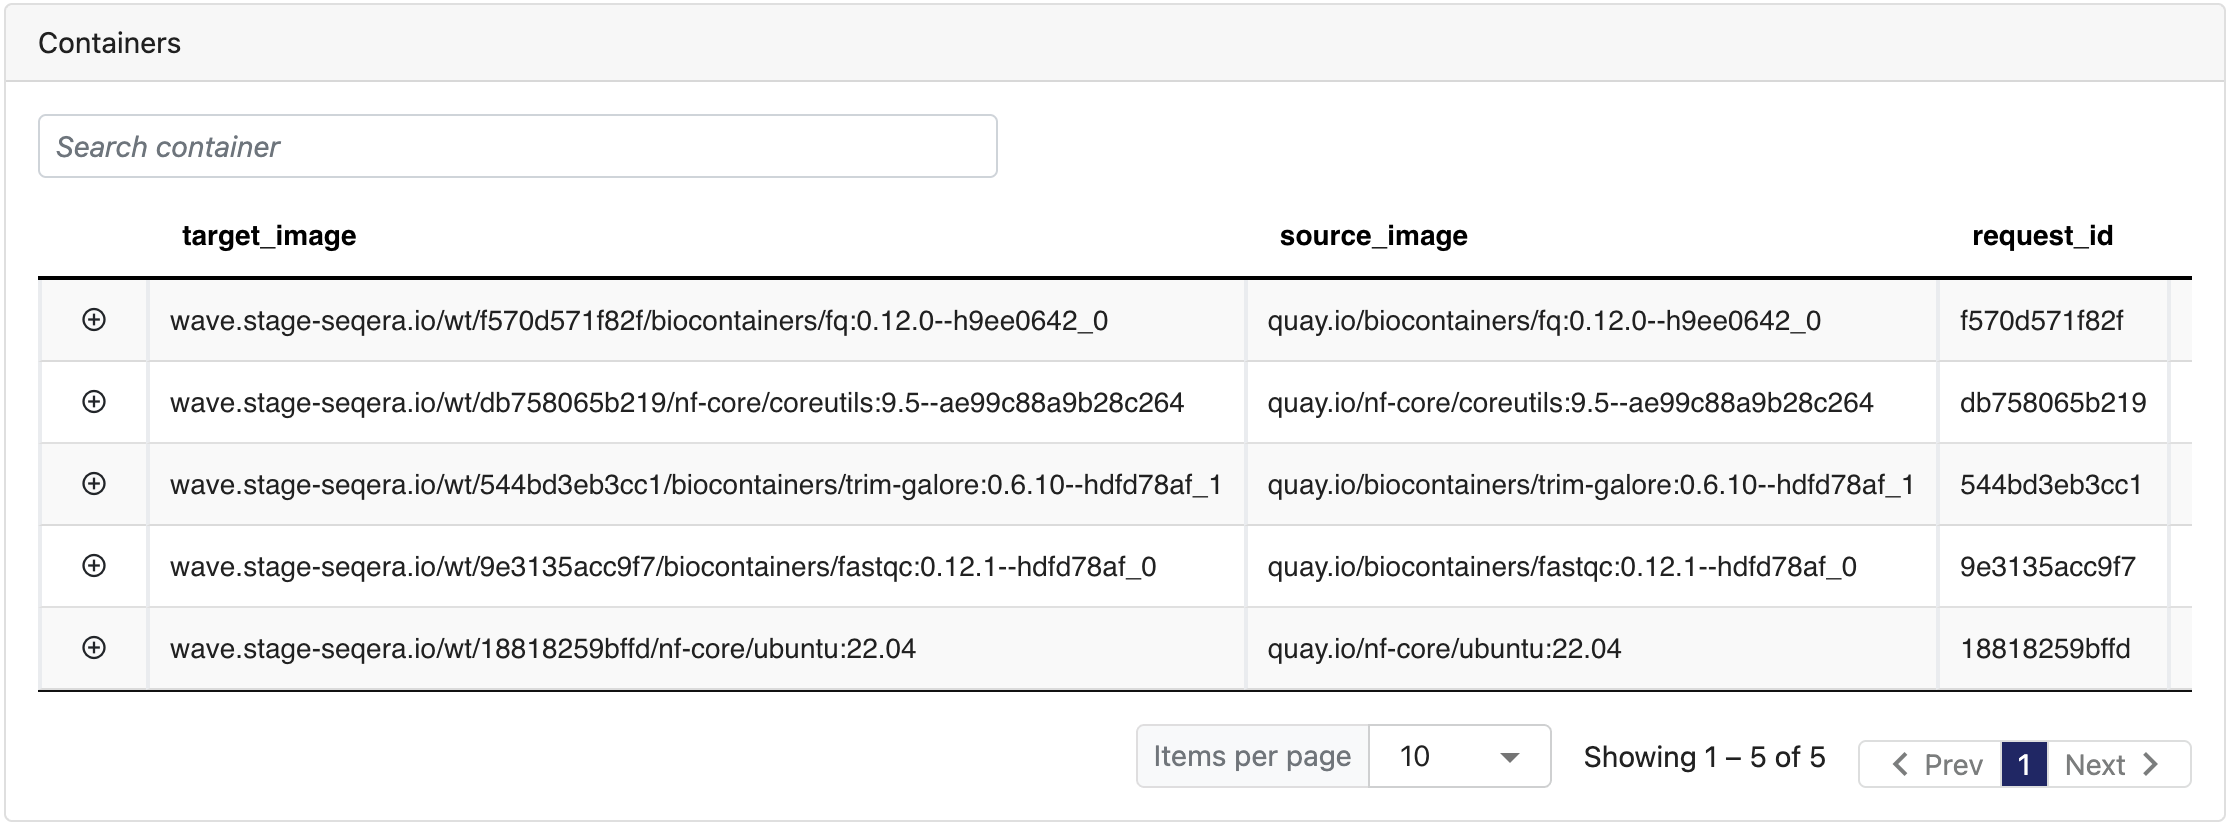
The Containers tab displays the details of containers used in the run, if any. Container details shown include:
- Target image: Container image used to execute the task.
- Source image: Container image specified in the workflow configuration, if available.
- Request ID: Unique request ID associated with the container.
- Request time: Timestamp when the container request was made.
- Build ID: Unique build ID assigned when the container was provisioned, linked to the Wave container build report.
- Mirror ID: Unique mirror ID assigned when the container was copied between repositories, linked to the Wave mirror report.
- Scan ID: Unique scan ID for the vulnerability security scan of the container, linked to the Wave scan report.
- Cached: Indicates if the container was built during a previous request.
- Freeze: Indicates if the container was provisioned for persistent storage using Wave freeze mode.
The Run Info tab contains at-a-glance details about the run, infrastructure, and executor. Hover over the information icon next to a card's name to view a value description. Select the icons next to any run detail values to copy them.
Run details
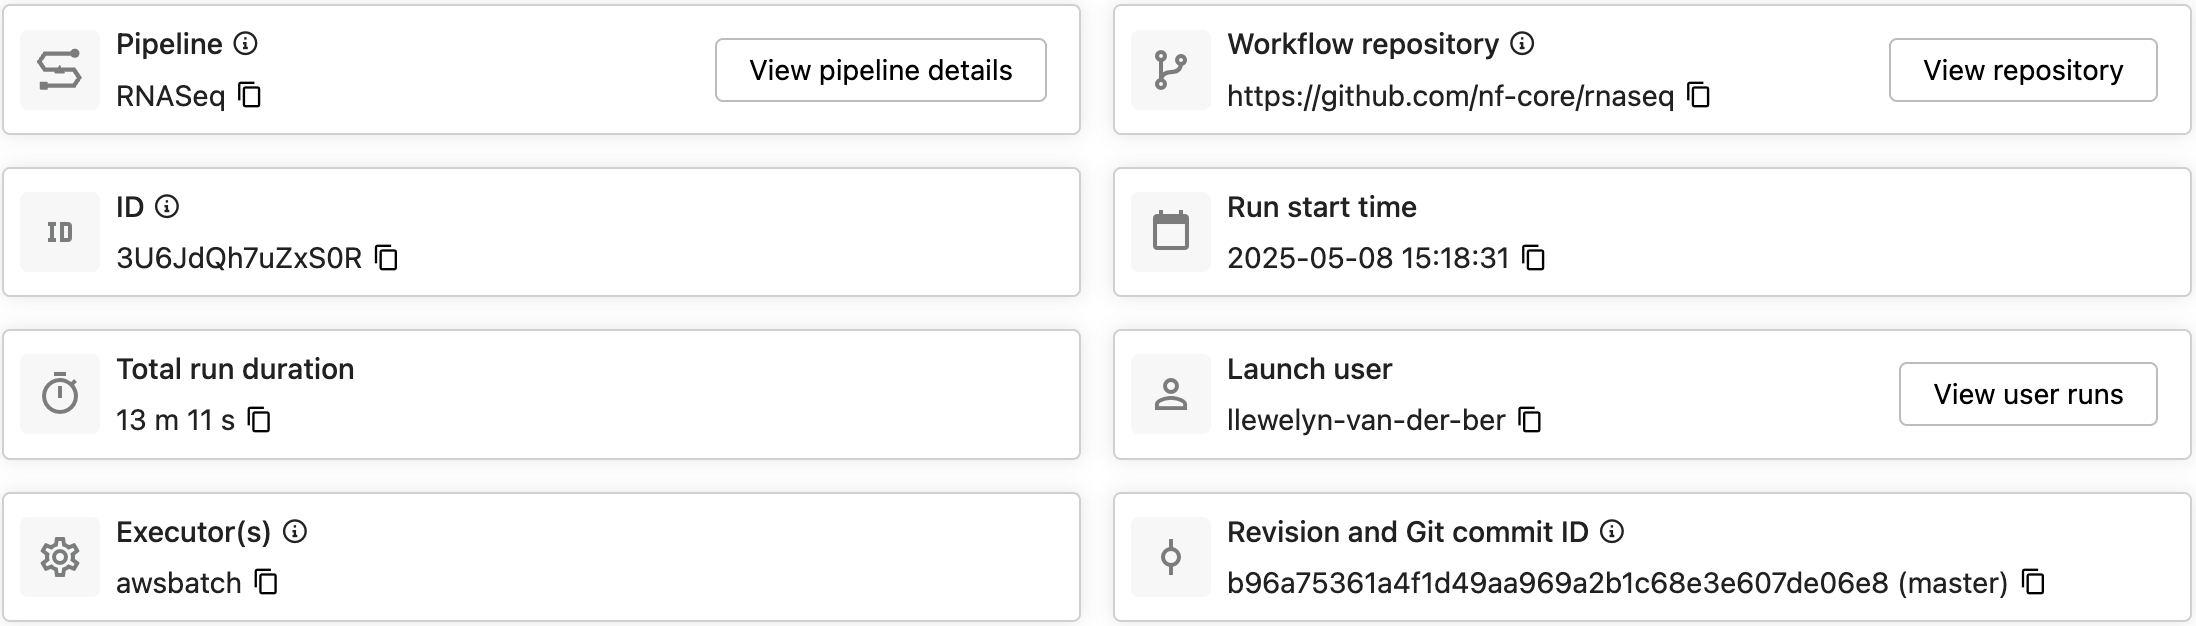
The Run details view displays basic run details:
- Pipeline name. Select View pipeline details to navigate to the pipeline's details page.
- Workflow repository. Select View repository to navigate to the pipeline Git repository.
- Run ID.
- Run start time.
- Total run duration.
- Launch user. Select View user runs to view a list of the launch user's runs in the same workspace.
- Executor(s) used for the run (AWS Batch, Azure Batch, etc.).
- Revision and Git commit ID. The pipeline version and Git commit ID associated with the version used for the run.
Infrastructure details
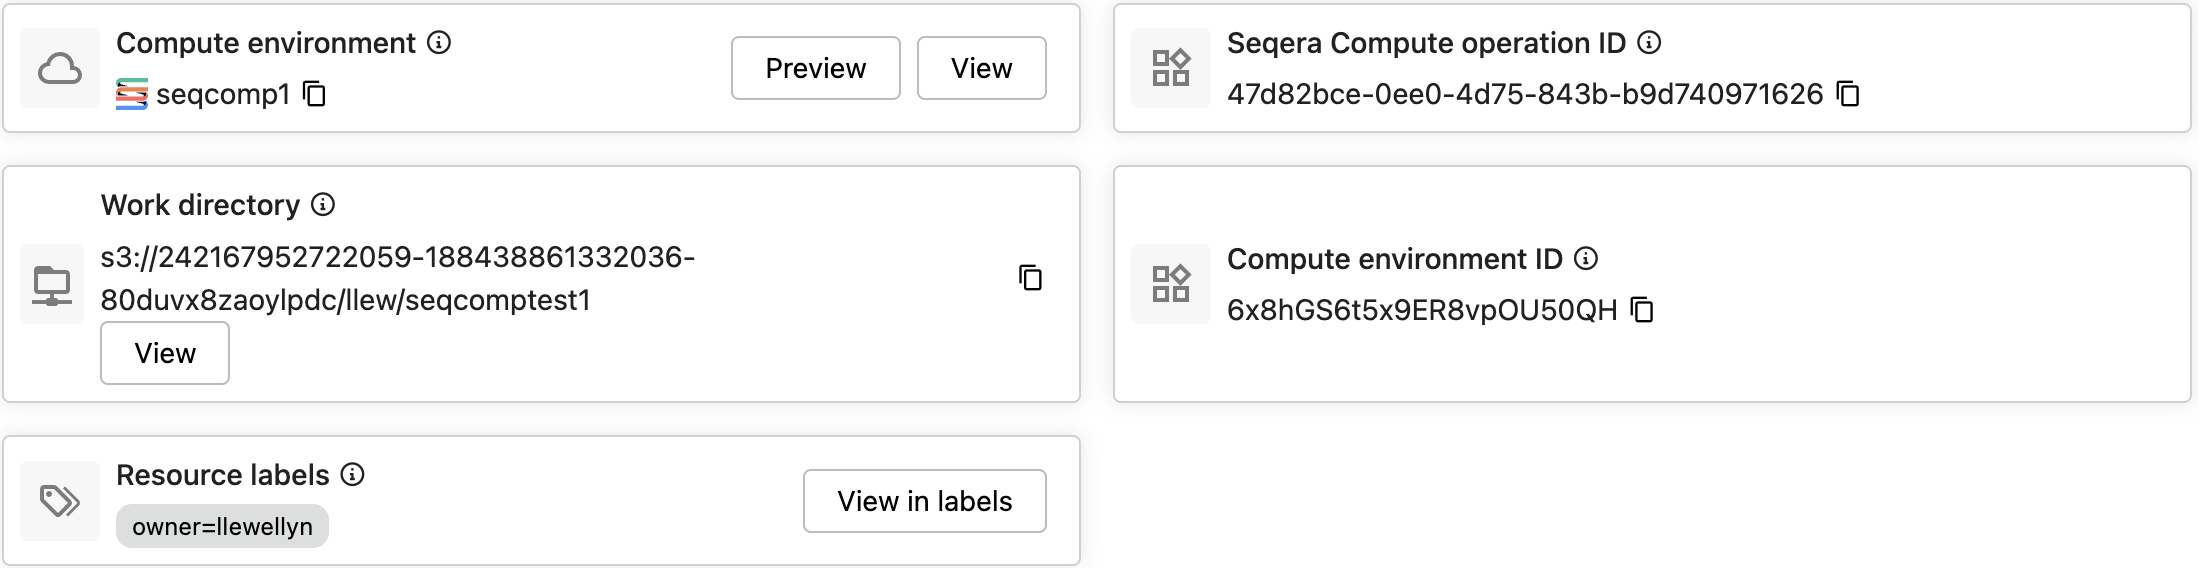
The Infrastructure details view displays compute environment and work directory information:
- Compute environment name. Select Preview to view a window with basic compute environment details, or View to navigate to the compute environment page.
- (Provider) operation ID. The unique identifier for the task submitted to the cloud provider or compute platform, such as an AWS Batch operation ID.
- Work directory. Select View to browse the work directory in Data Explorer.
- Compute environment ID.
Executor(s) details

View run executor details: