Explore the Community Showcase
The Community Showcase is a Seqera-managed demonstration workspace. All Seqera Cloud users can access it, and it contains everything you need for this tutorial.
In this tutorial, you:
- Launch and monitor the nf-core/rnaseq pipeline, which analyzes RNA sequencing data.
- Select pipeline input data with Data Explorer and Platform datasets.
You need the following:
- A Seqera Cloud account
The workspace Launchpad lists preconfigured pipelines. Each Launchpad pipeline combines a pipeline repository, a compute environment, and launch parameters. The workspace also includes AWS compute environments to run its pipelines, plus datasets and public data sources for pipeline input.
Launch the nf-core/rnaseq pipeline
Go to the Launchpad in the community/showcase workspace and select Launch next to the nf-core-rnaseq pipeline to open the launch form.
This guide is based on version 3.22.1 of the nf-core/rnaseq pipeline. Launch form parameters differ in other versions.
The launch form steps through General config, Run parameters, Advanced settings, and Summary. Select a step at the top of the form to move between steps. You can also select Previous and Next. Select Launch when you're ready to start the run.
Nextflow parameter schema
Platform renders the launch form's pipeline parameters from a pipeline schema file, nextflow_schema.json, in the root of the pipeline Git repository. The schema describes each pipeline parameter. Pipeline developers write one to run their own Nextflow pipelines in Platform.
See Best Practices for Deploying Pipelines with the Seqera Platform to generate a parameter schema for a Nextflow pipeline with nf-core tooling.
General config
The Run setup section shows how the pipeline launches. Showcase pipelines are preconfigured. Most fields are read-only, including the pipeline repository and revision, config profiles, compute environment, and work directory.
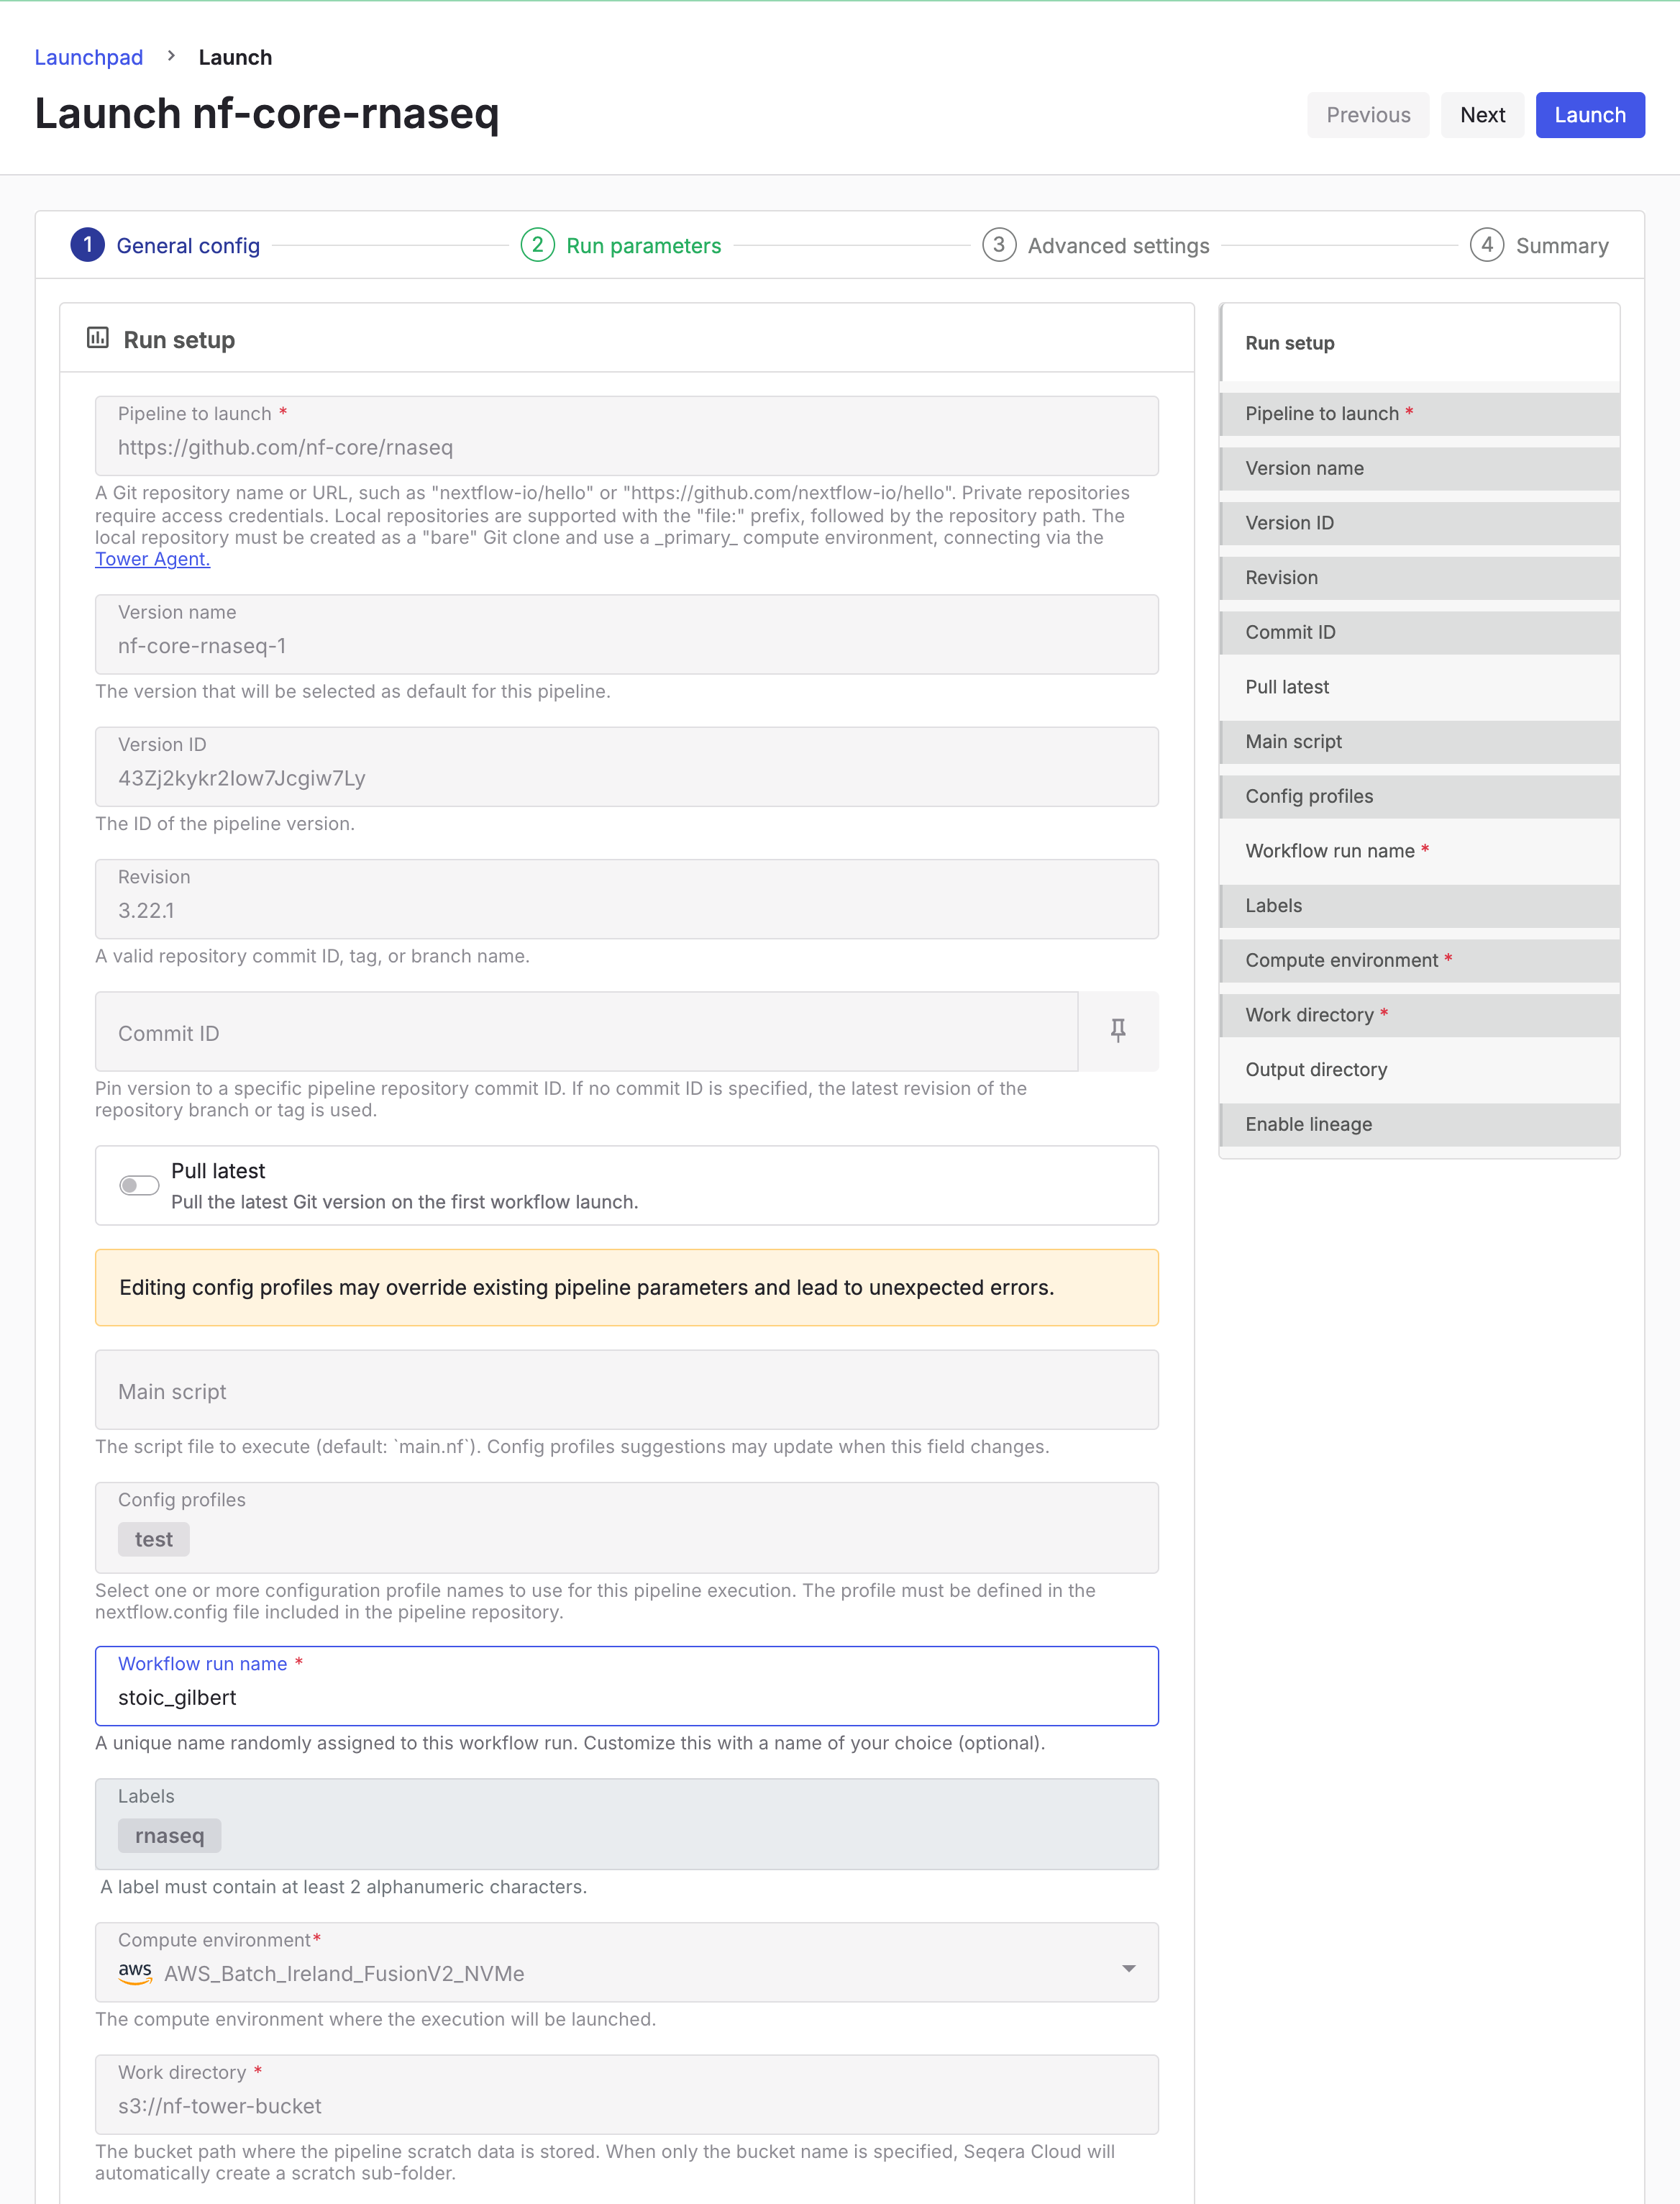
Set the following fields to identify your run among other workspace runs:
- Workflow run name: A unique identifier for the run. Platform pre-fills a random name, which you can change.
- Labels: New or existing labels for the run, such as a project ID or genome version.
Run parameters
Enter Run parameters in one of three ways:
- Input form view displays a form with text fields, drop-downs, and Browse buttons for input and output locations.
- Params file view displays the raw parameters for direct editing. Select JSON or YAML from the View as drop-down.
- Upload params file accepts a JSON or YAML file with run parameters.
input
Most nf-core pipelines use the input parameter to specify an input samplesheet. The samplesheet lists paths to input files, such as FASTQ files, and any additional metadata the pipeline needs.
Select Browse next to input to choose a file. The dialog shows the file pattern from the pipeline schema. The selected file must match it. Select a file from either tab:
- In the Datasets tab, search for and select
rnaseq_sample_data. - In the Data Explorer tab, select the
nf-tower-databucket, then search for and select thernaseq_sample_data.csvfile.
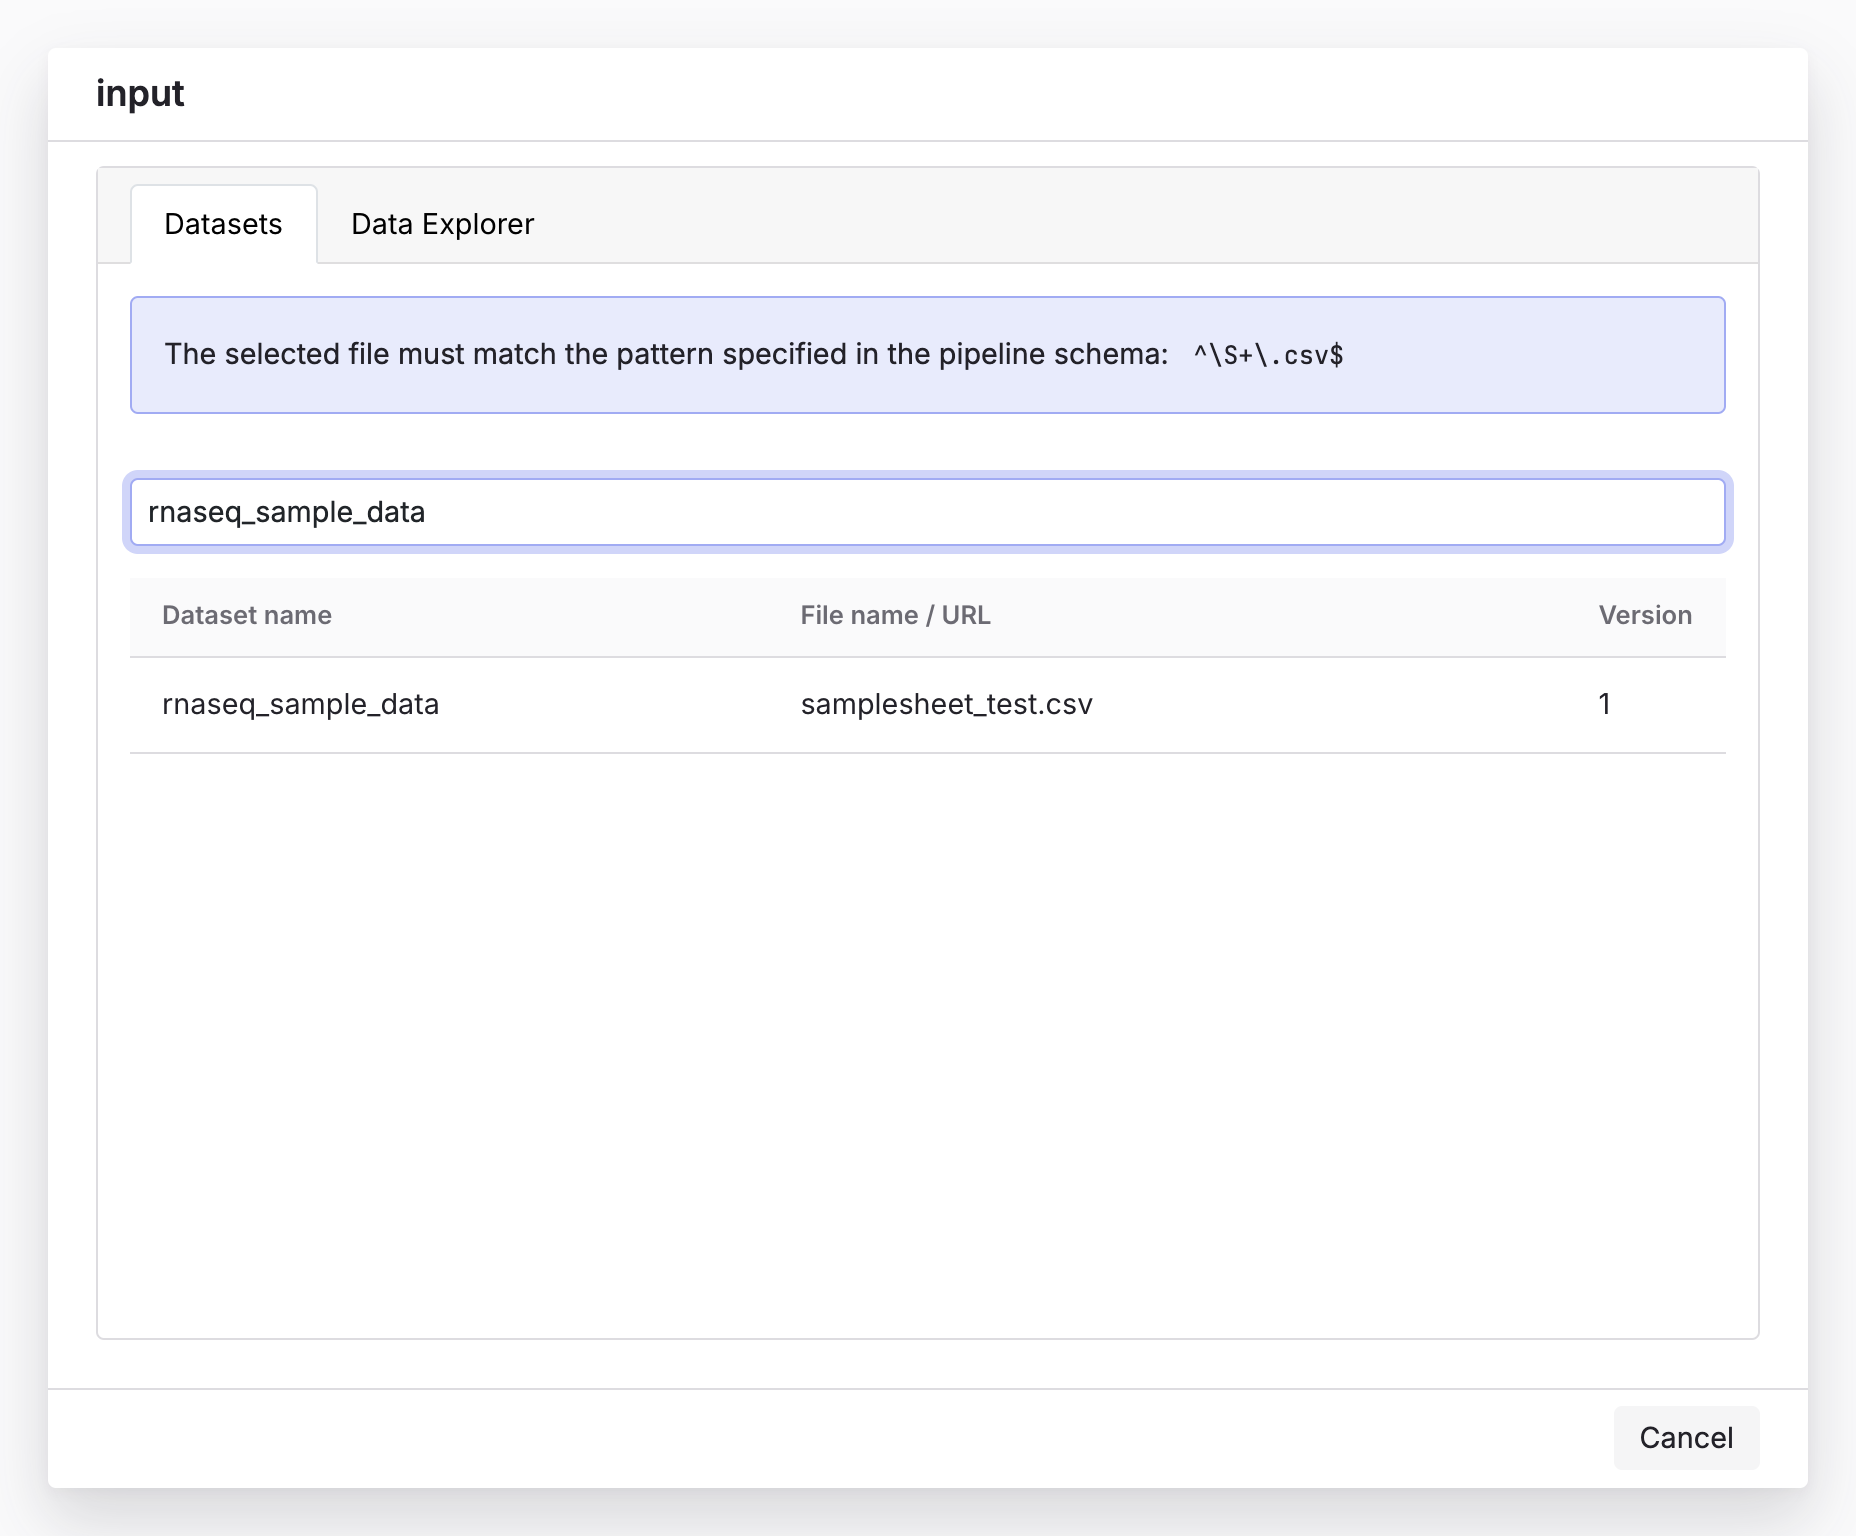
See Add data to learn how to add datasets and Data Explorer cloud buckets to your own workspaces.
output
Most nf-core pipelines use the outdir parameter to specify where the pipeline publishes final results. Use a unique outdir for each run. Otherwise, the new run overwrites earlier results.
For this tutorial test run, keep the default outdir value (./results).
In your own workspace, select Browse next to outdir to choose a cloud storage directory in Data Explorer, or enter a cloud storage path.
Set pipeline-specific parameters
Change other parameters in the form to customize the run. For example, under Read trimming options, set trimmer to fastp instead of trimgalore.
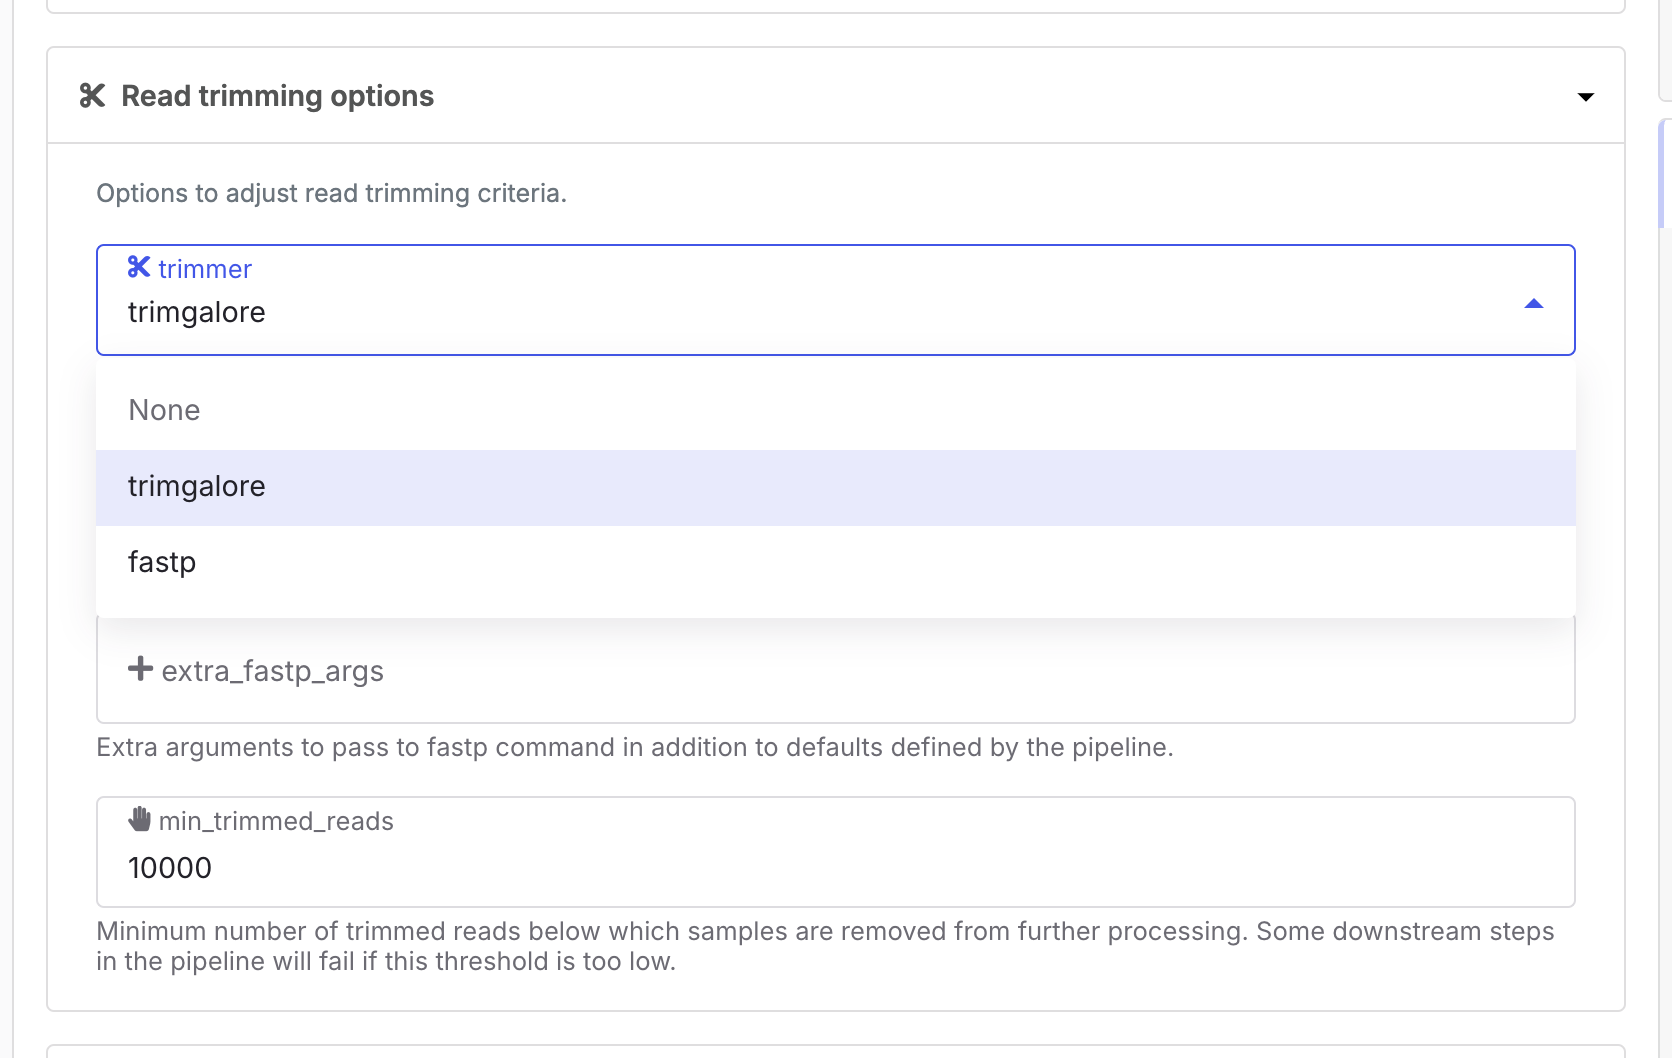
Select Launch to start the run. Your run appears in the workspace Runs list with a Submitted status.
View run information
Select a run in the Runs list to open its run details page. The header shows the run status, name, and key details, such as the run ID, pipeline, work directory, compute environment, and start time. A progress bar tracks the run's progress.
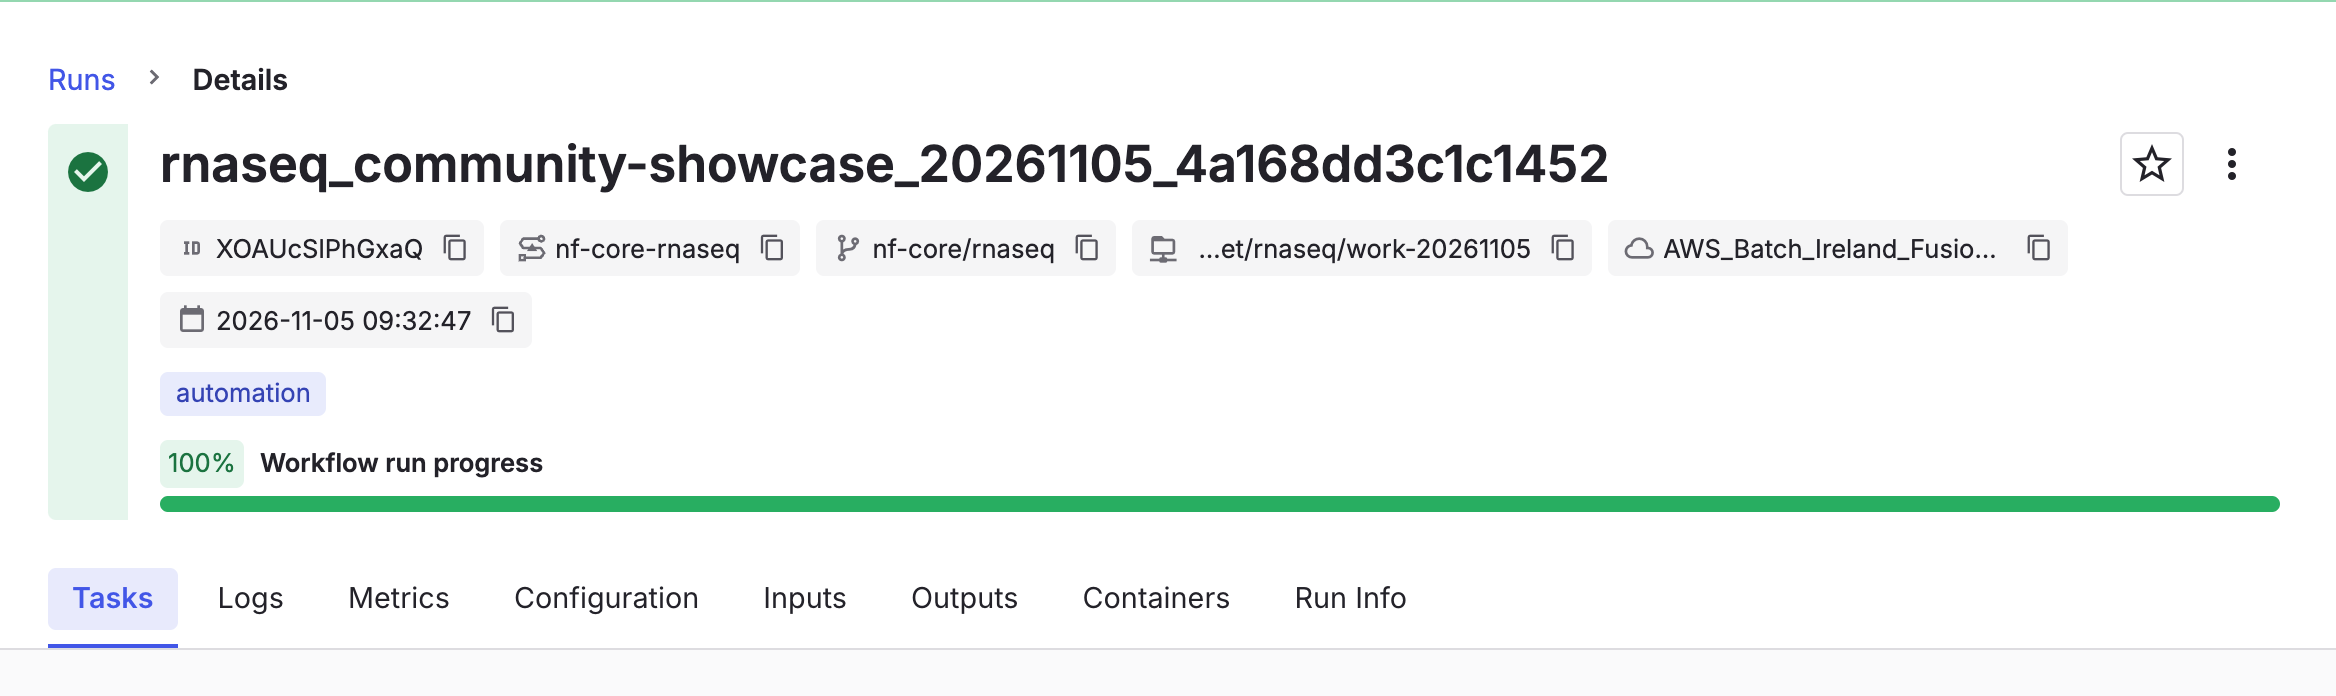
Tabs below the header organize the rest of the run information.
Tasks
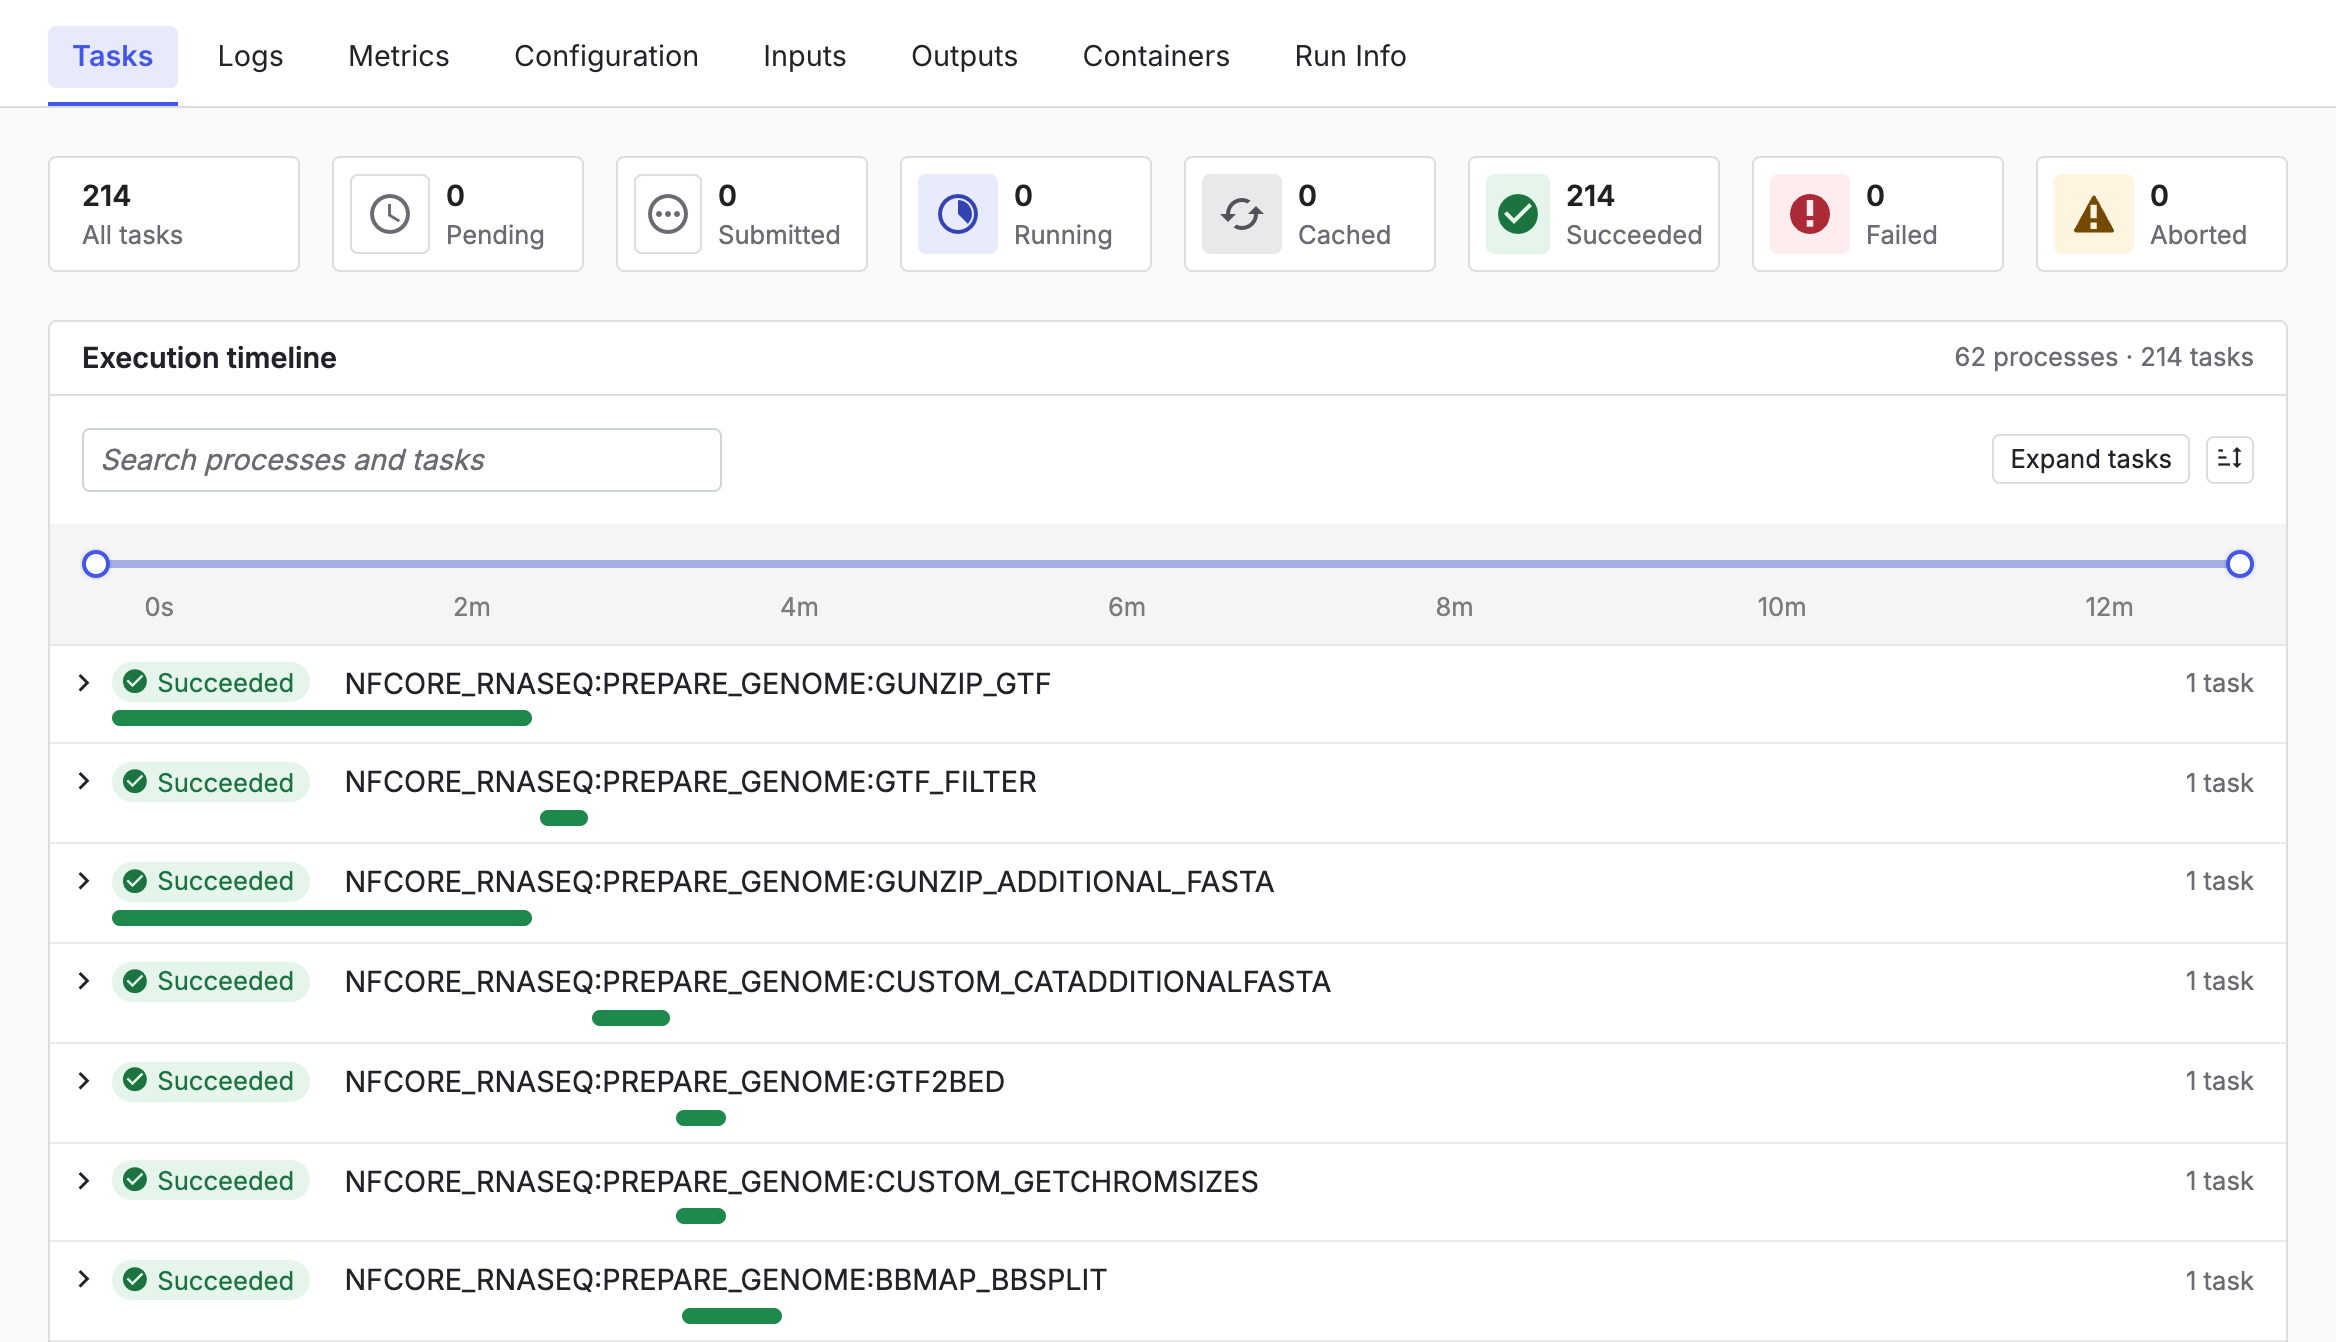
The Tasks tab opens by default. It shows task progress and the execution timeline. Use it to follow a run in progress.
Status tiles at the top count the tasks in each state, such as Running, Succeeded, and Failed.
The Execution timeline shows each pipeline process on a shared time axis. Each row shows the process status, name, and task count. A bar marks when the process ran and for how long. To explore the timeline:
- Search for processes and tasks by name.
- Select Expand tasks, or select a process row, to show individual tasks.
- Drag the handles on the time slider to zoom in on part of the run.
The Tasks table below the timeline lists every task in the run with its status, attempt, exit code, duration, and resource usage. Search the table to find a task.
Task details
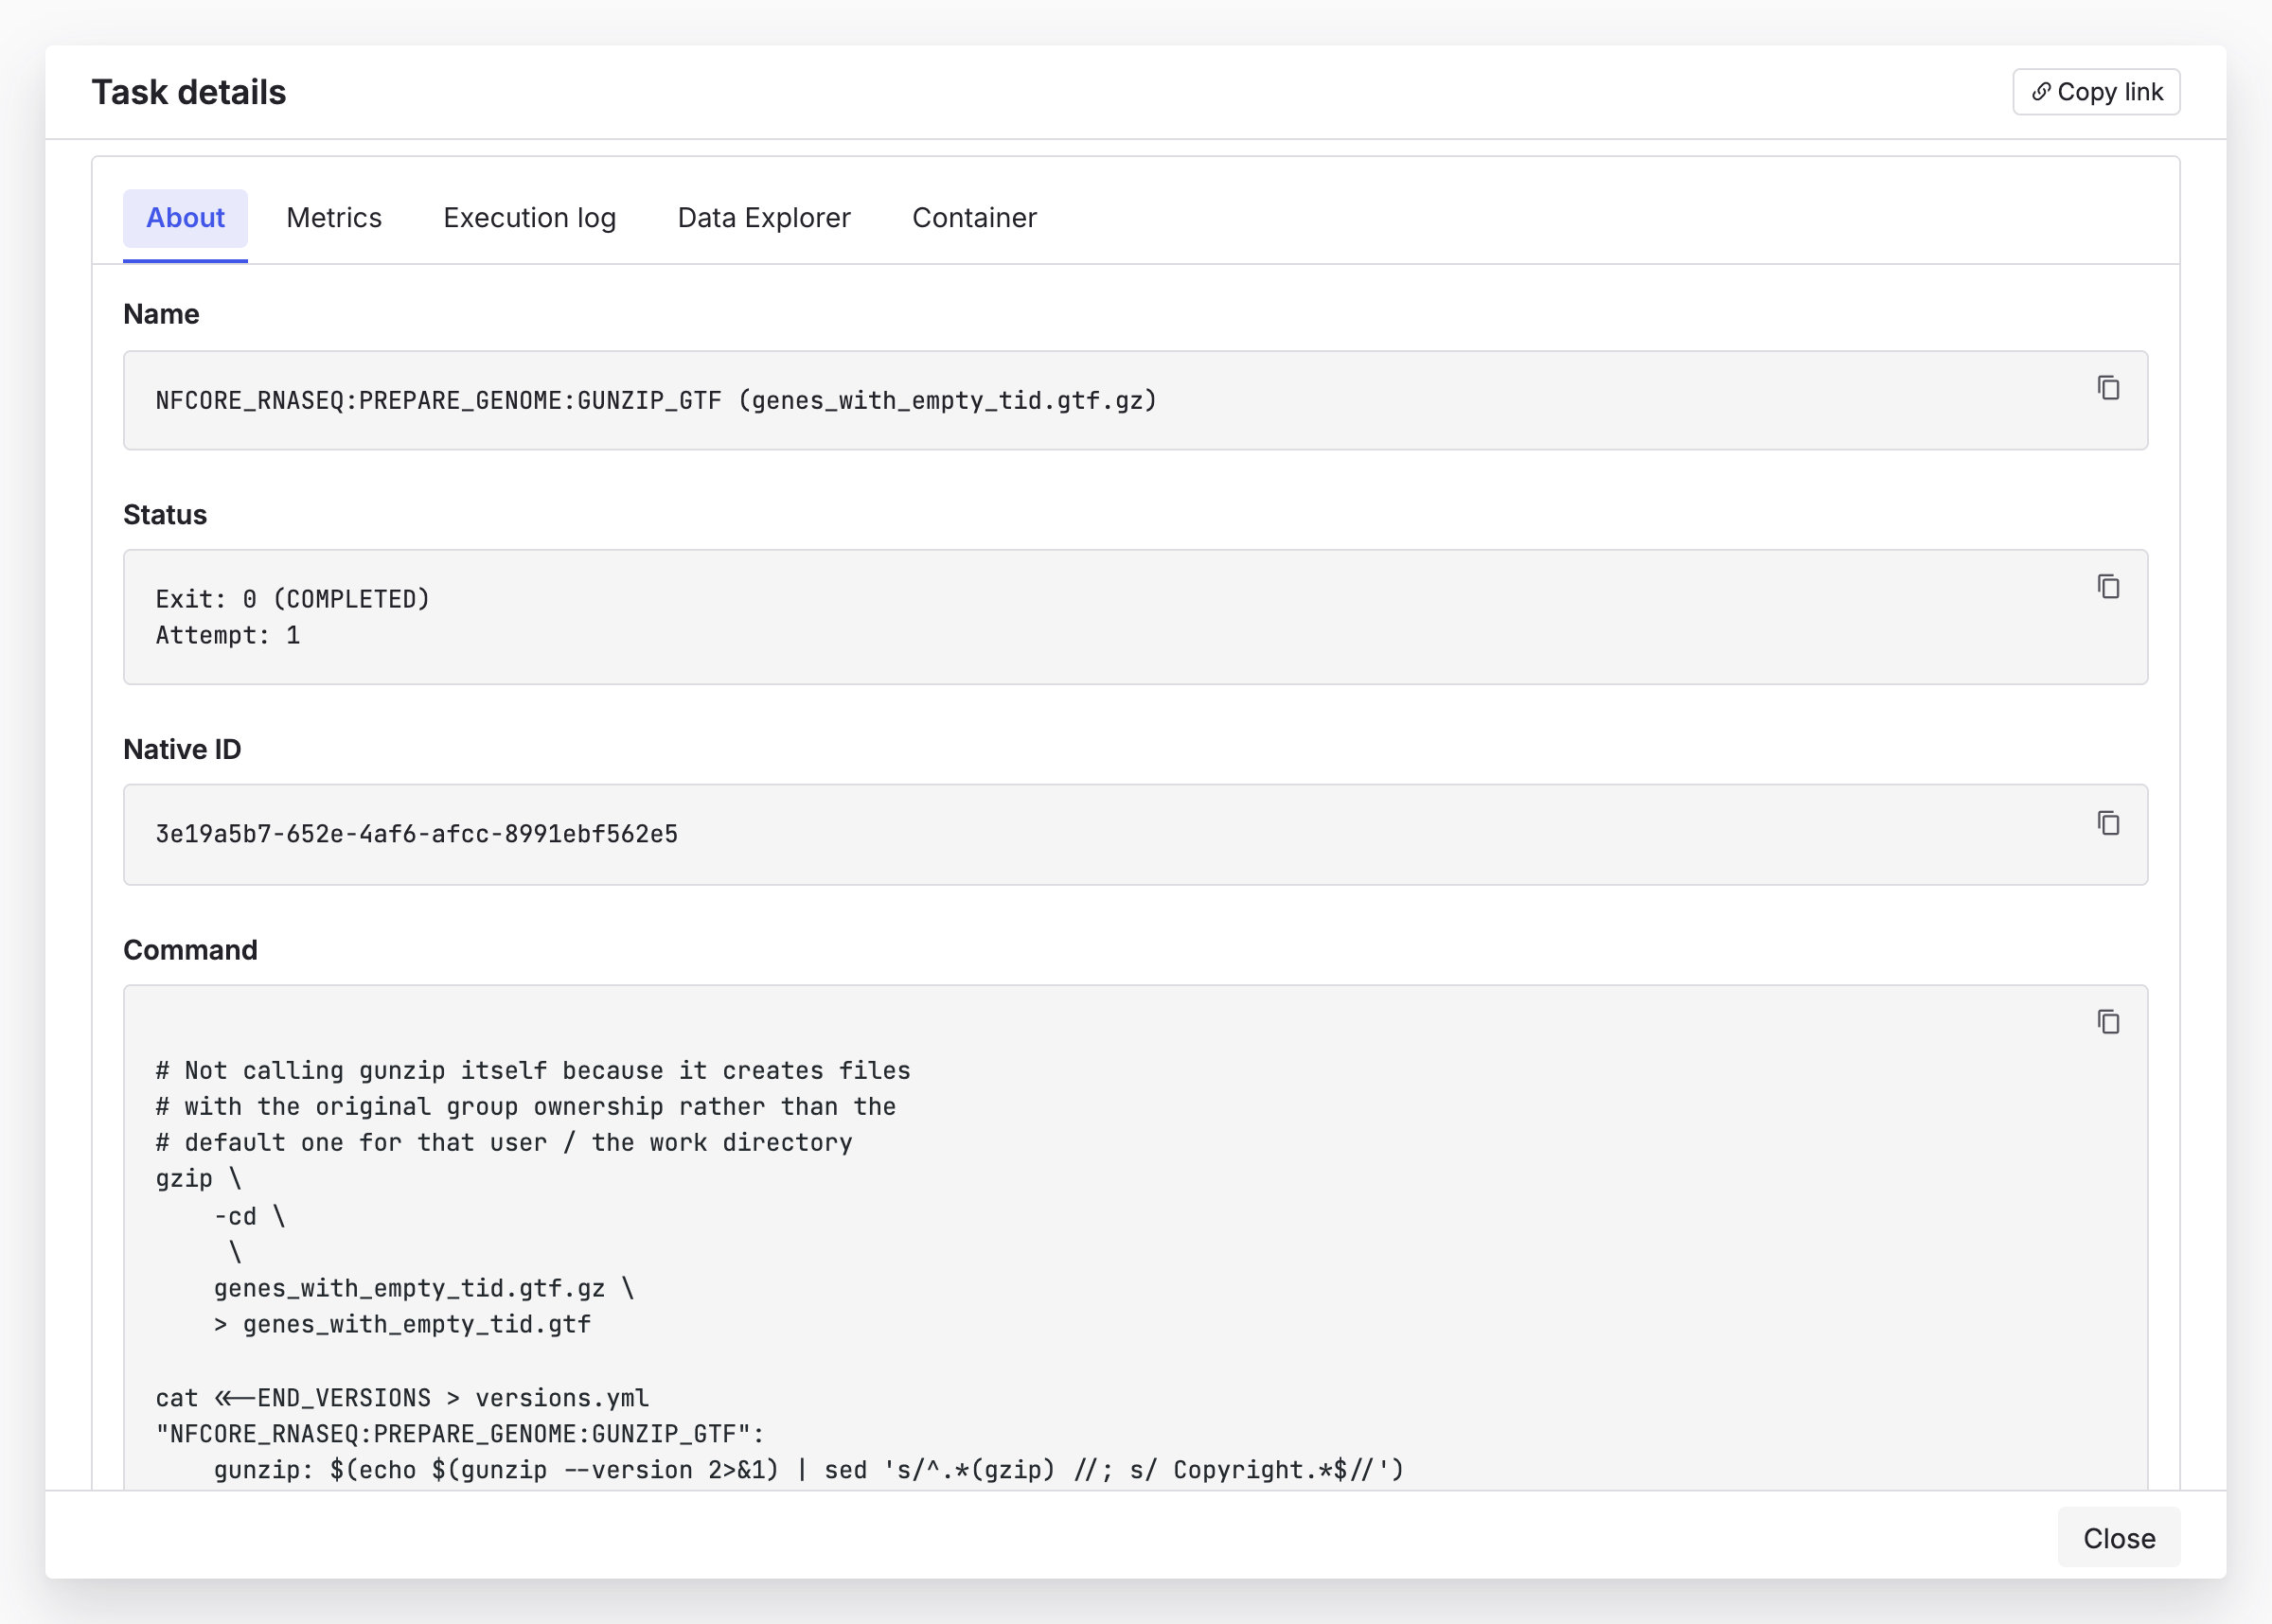
Select a task in the Tasks table to open the Task details dialog. Select Copy link to copy a link to the task. The dialog has five tabs:
- About: The task name and tag, status and exit code, native ID, command, environment variables, and work directory
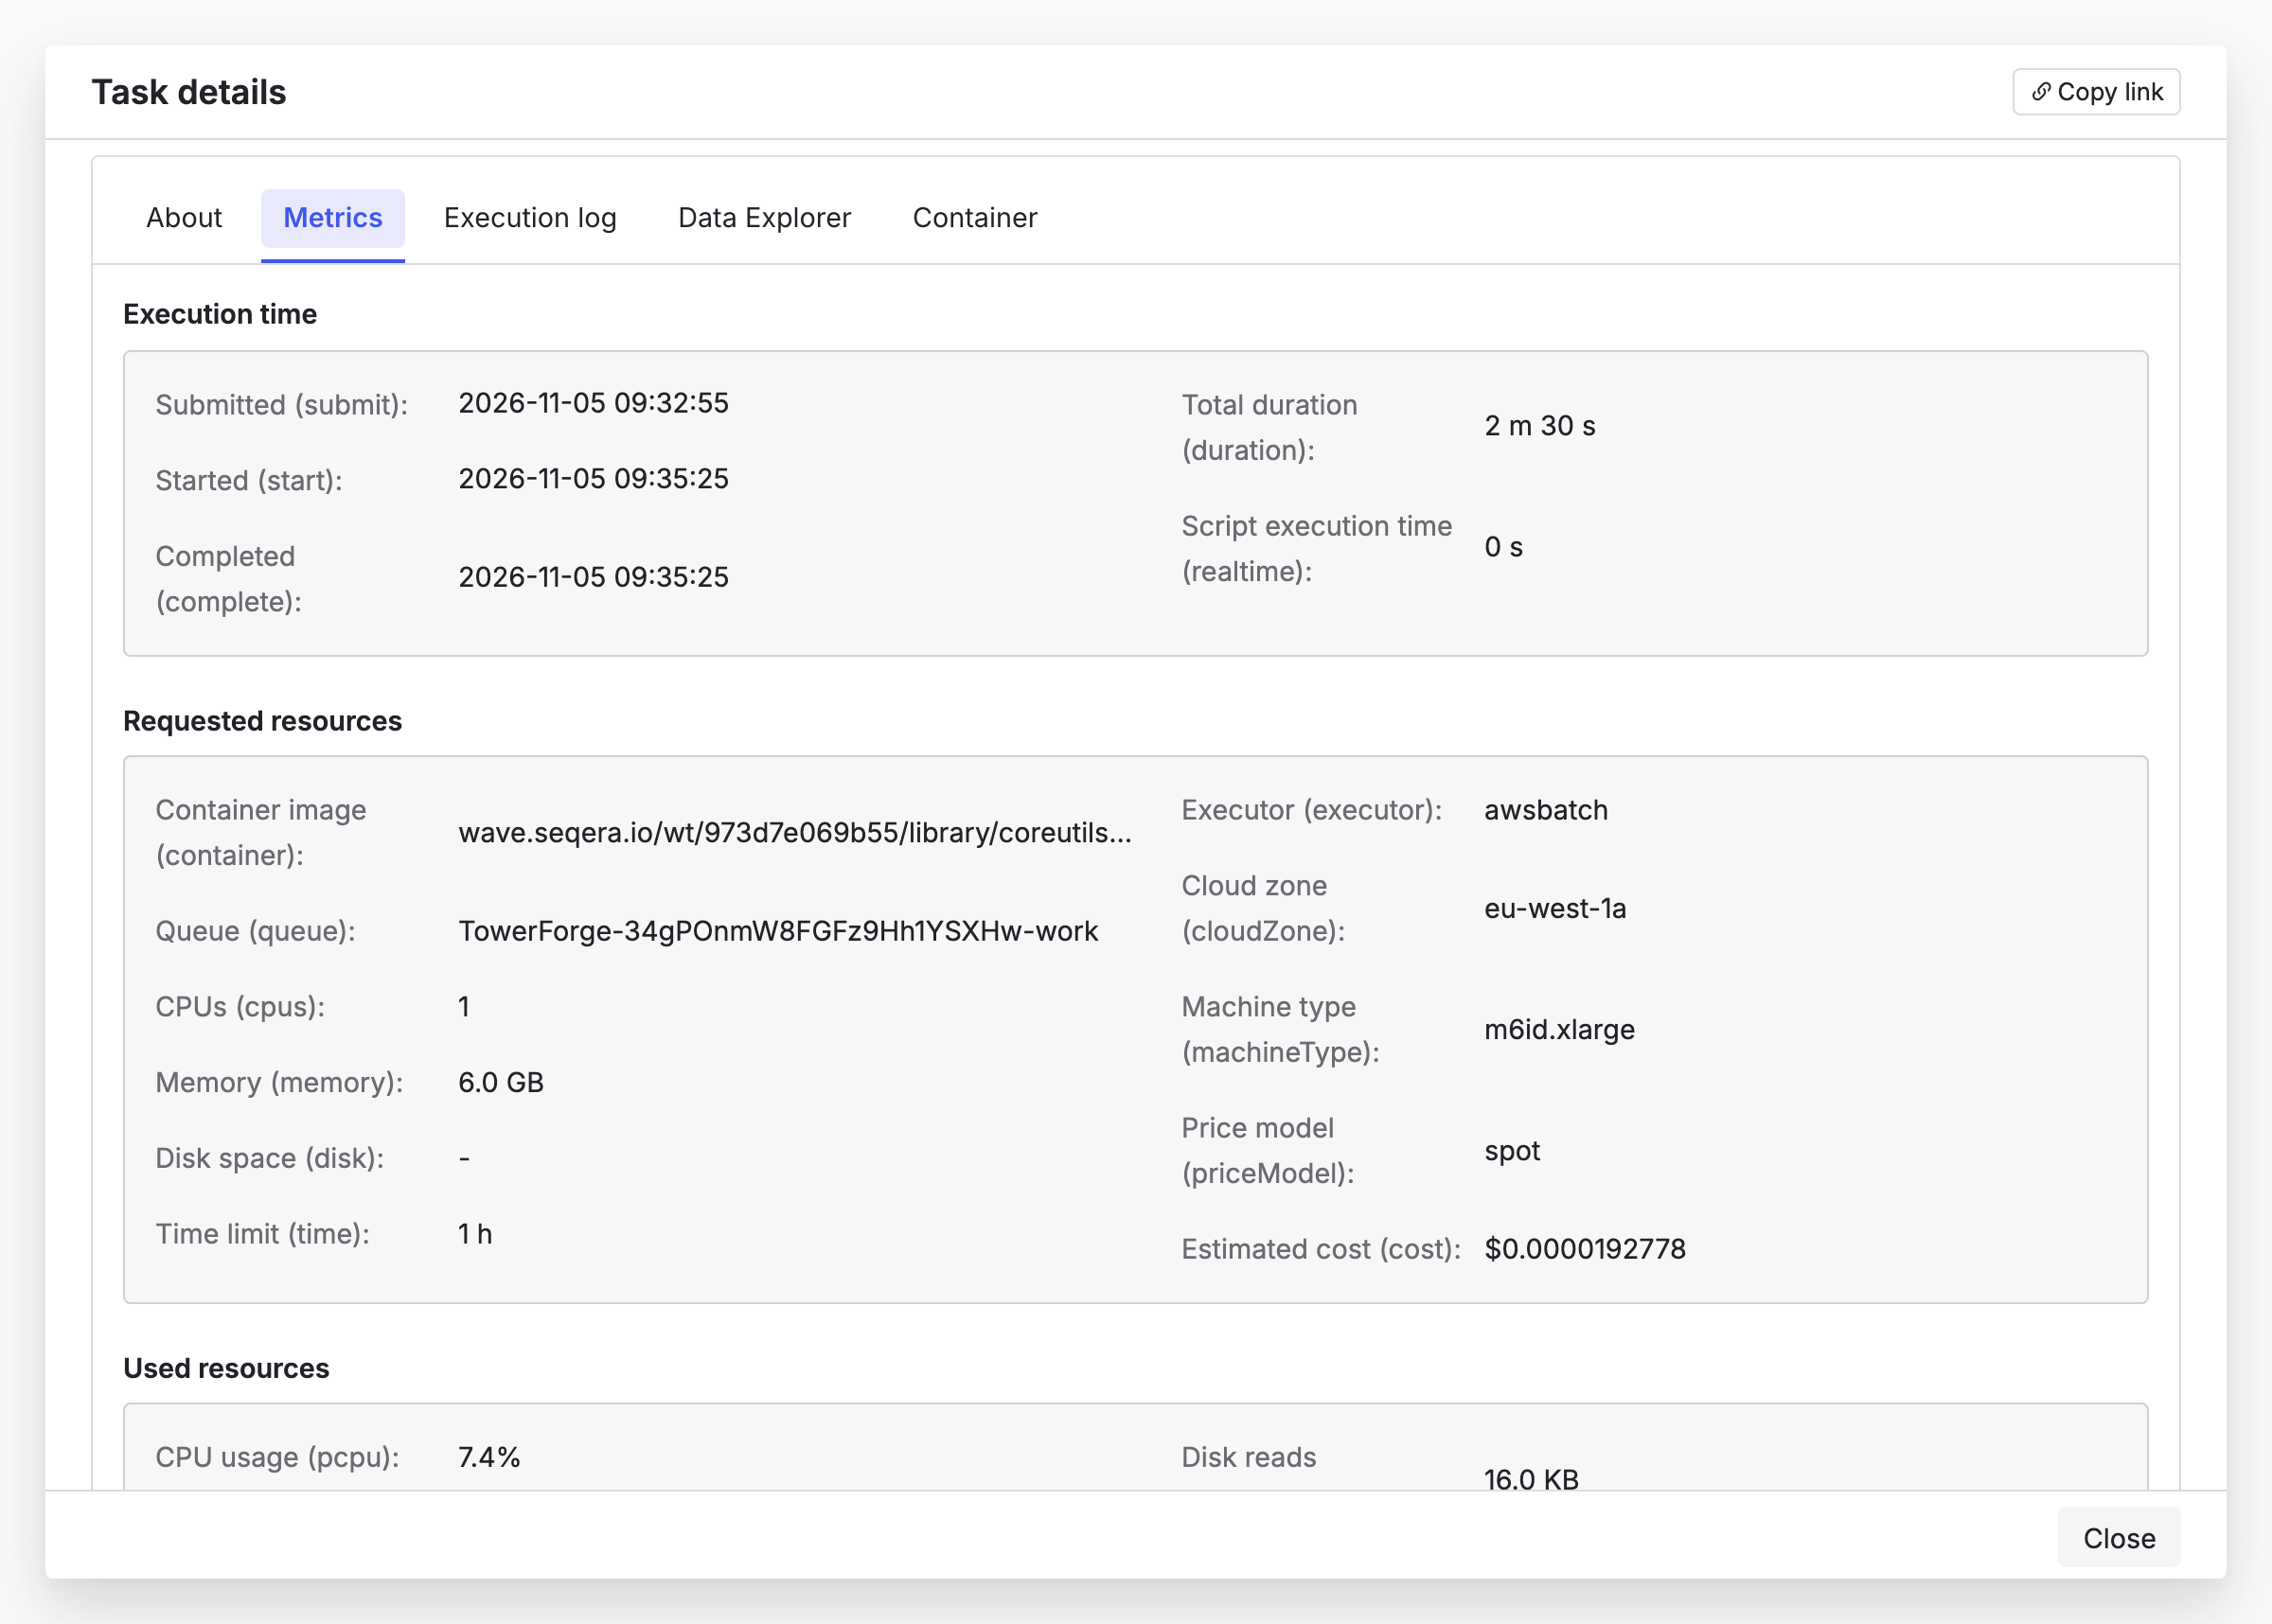
- Metrics: Execution times, requested resources, and used resources
- Execution log: A live log of the task's execution. Download task logs, such as
stdoutandstderr, while they remain in your compute environment. - Data Explorer: The task's work directory
- Container: The container the task ran in
The Metrics tab shows when the task was submitted, started, and completed. It also compares the resources the task requested with the resources it used, and shows where the task ran and its estimated cost.
Task work directory
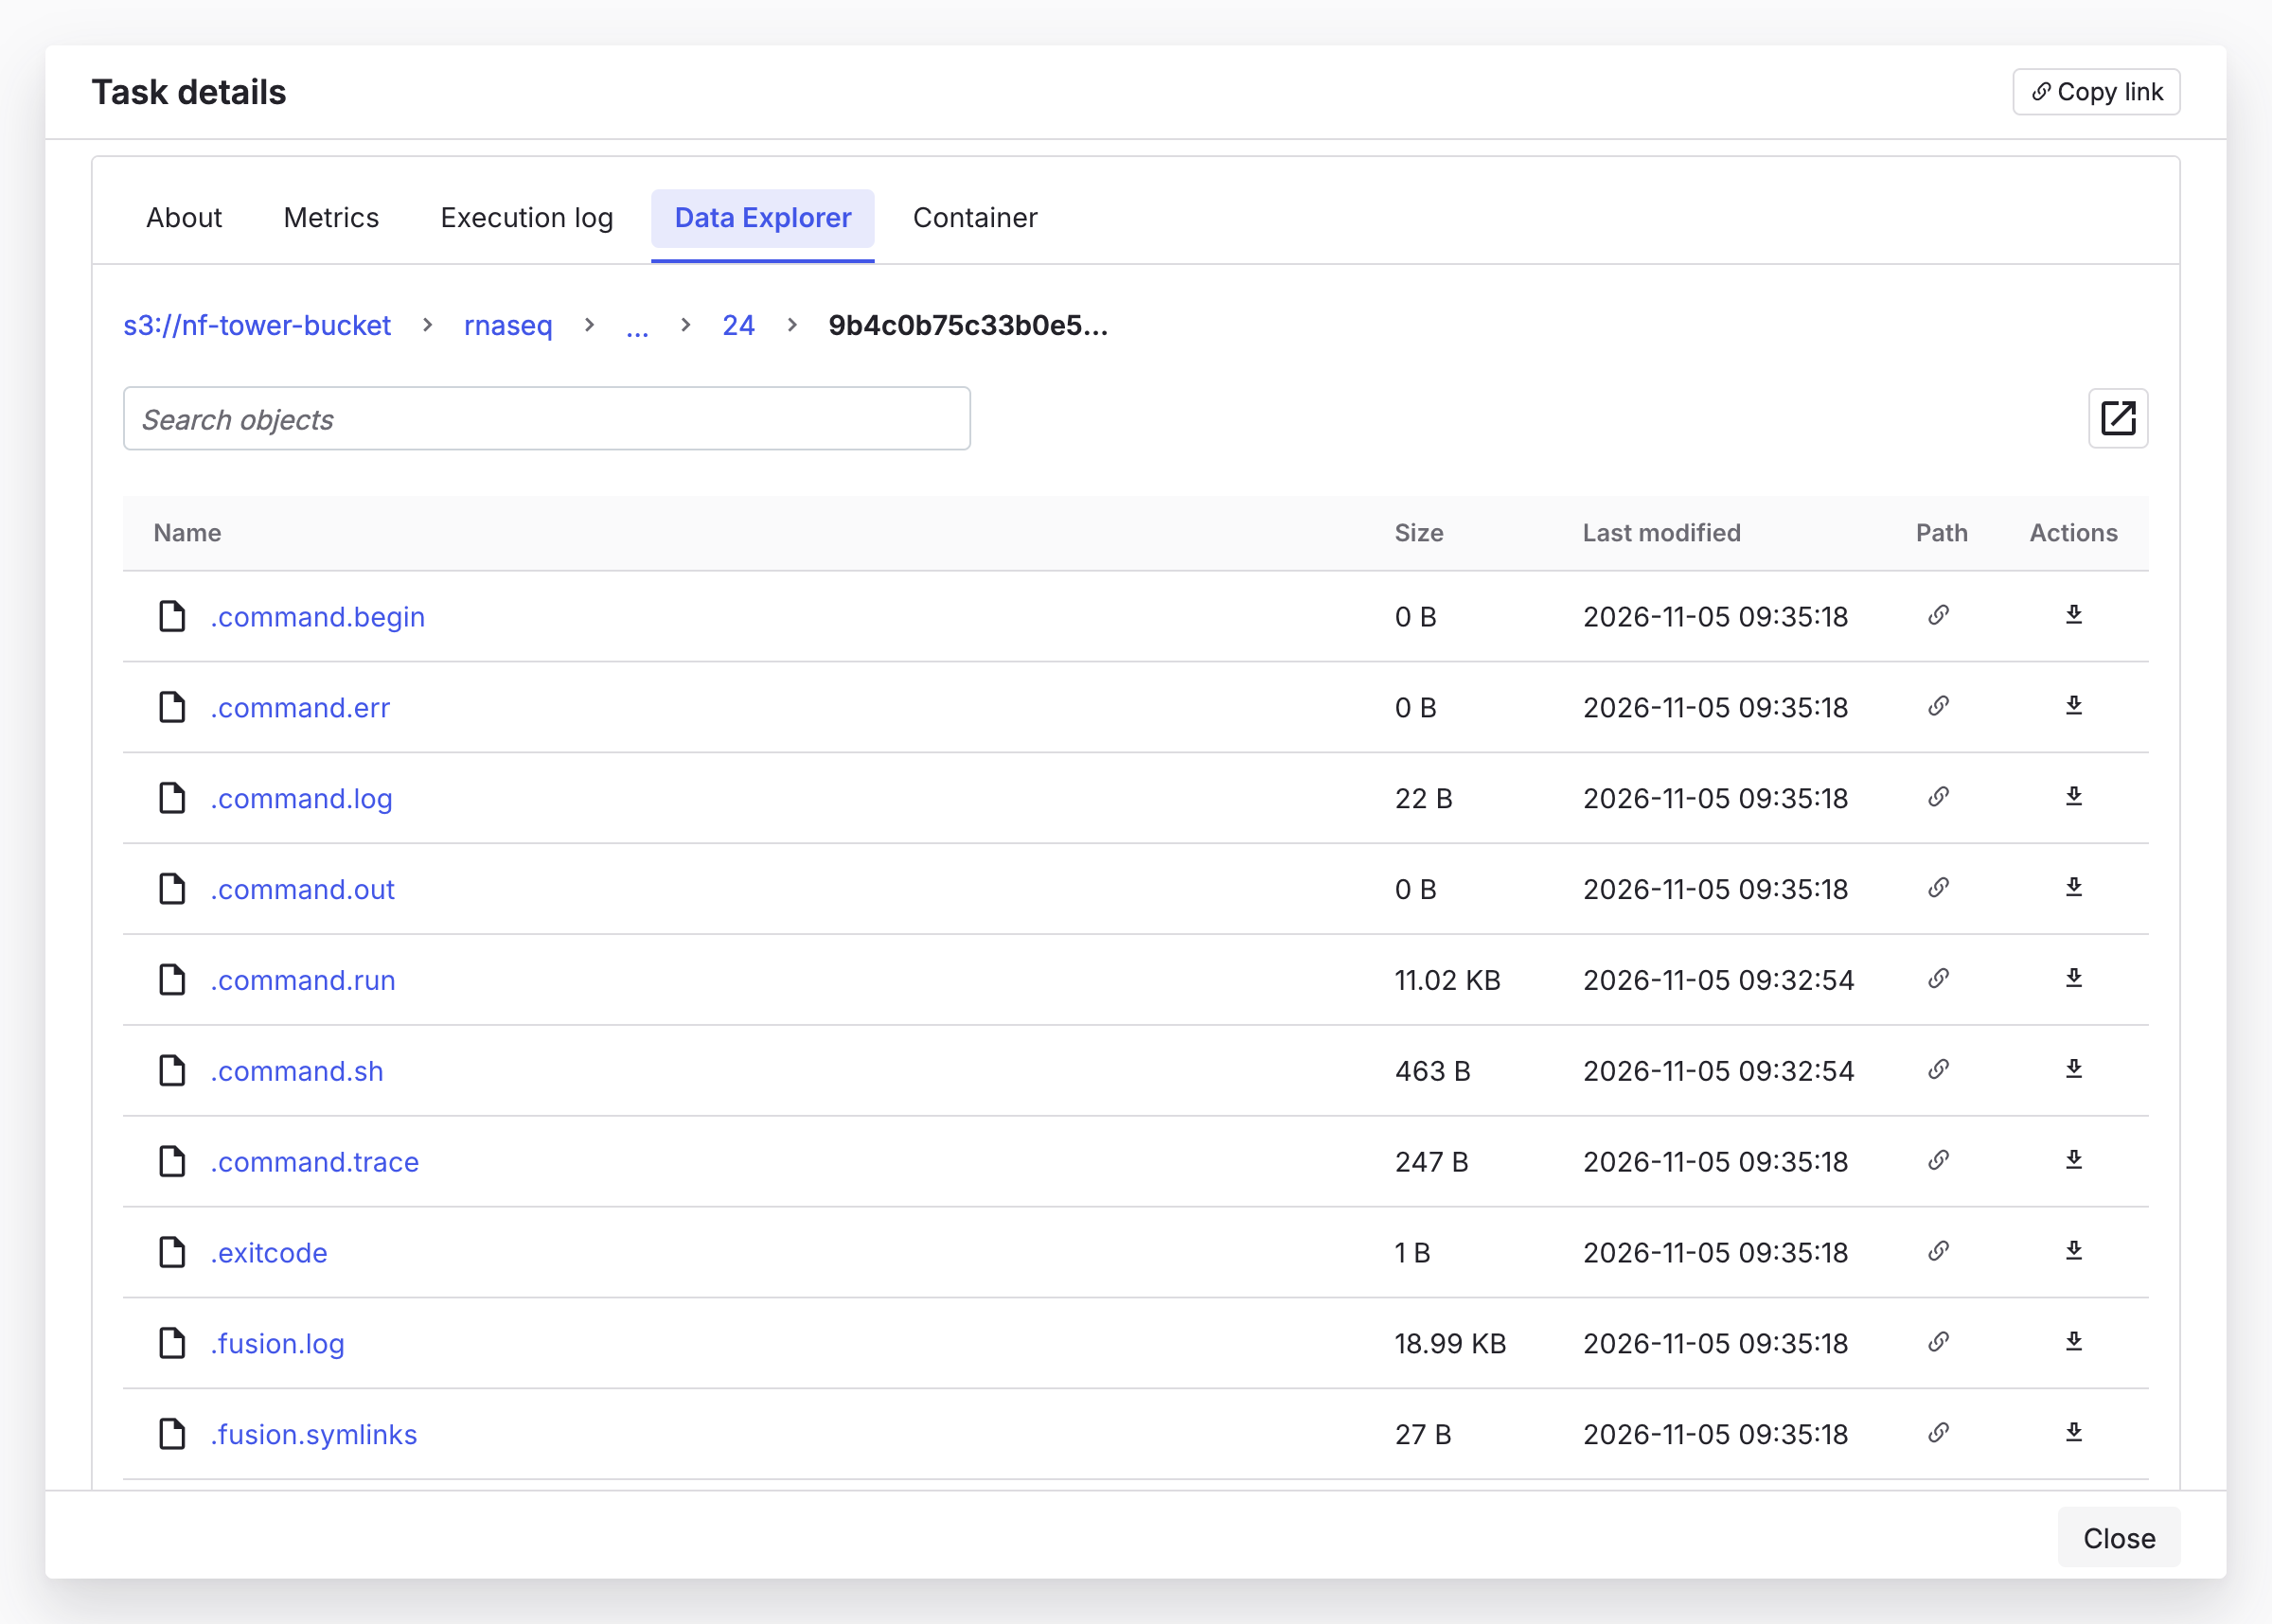
When a task fails, start troubleshooting in its work directory. Nextflow creates a unique, hash-named work directory for each task.
Select the Data Explorer tab in the Task details dialog to browse the work directory without opening the cloud console. View or download the task's log and output files, or copy a link to them.
Logs
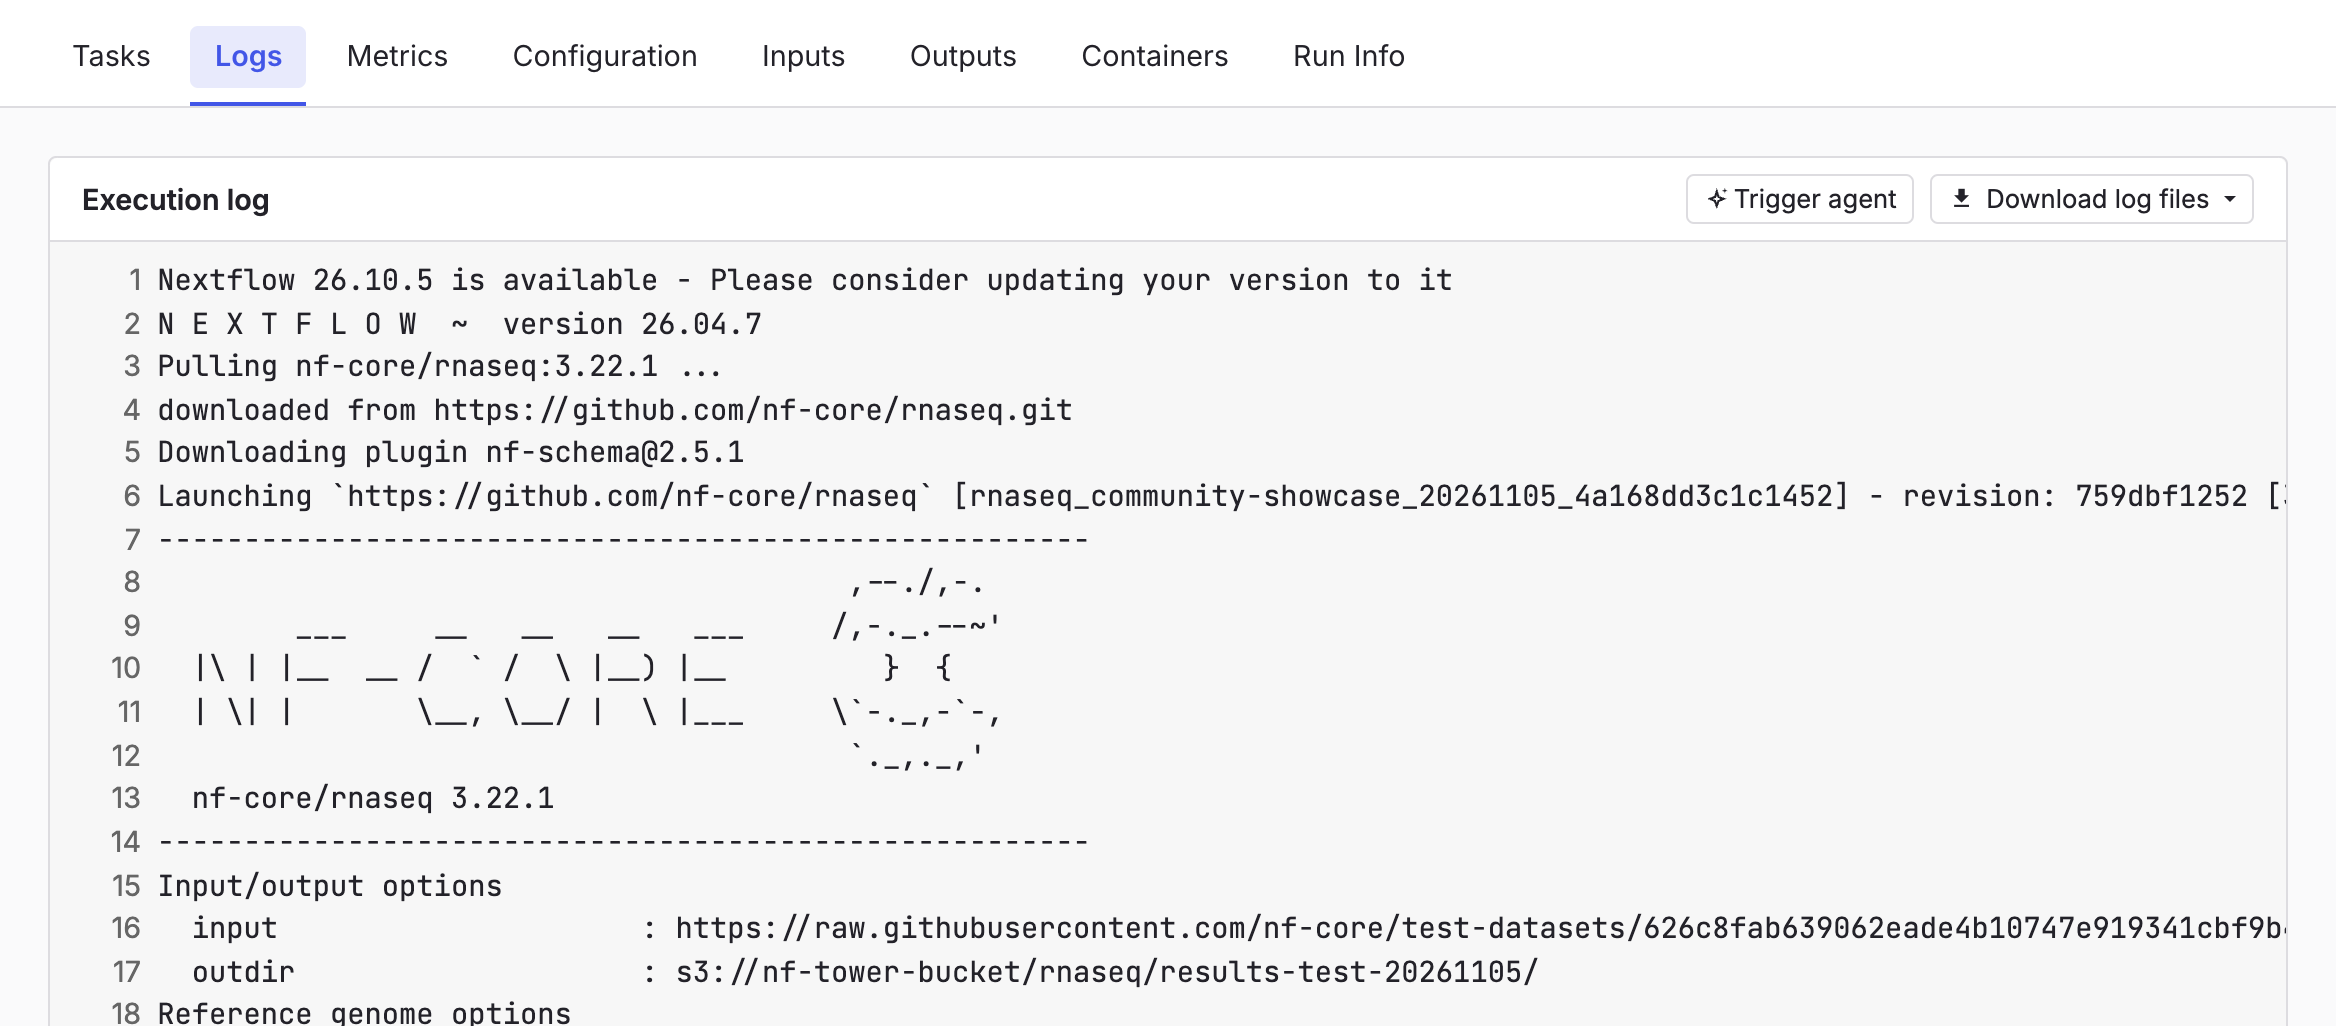
The Logs tab shows the Nextflow execution log for the run. Select Download log files to download the run's log files.
Metrics
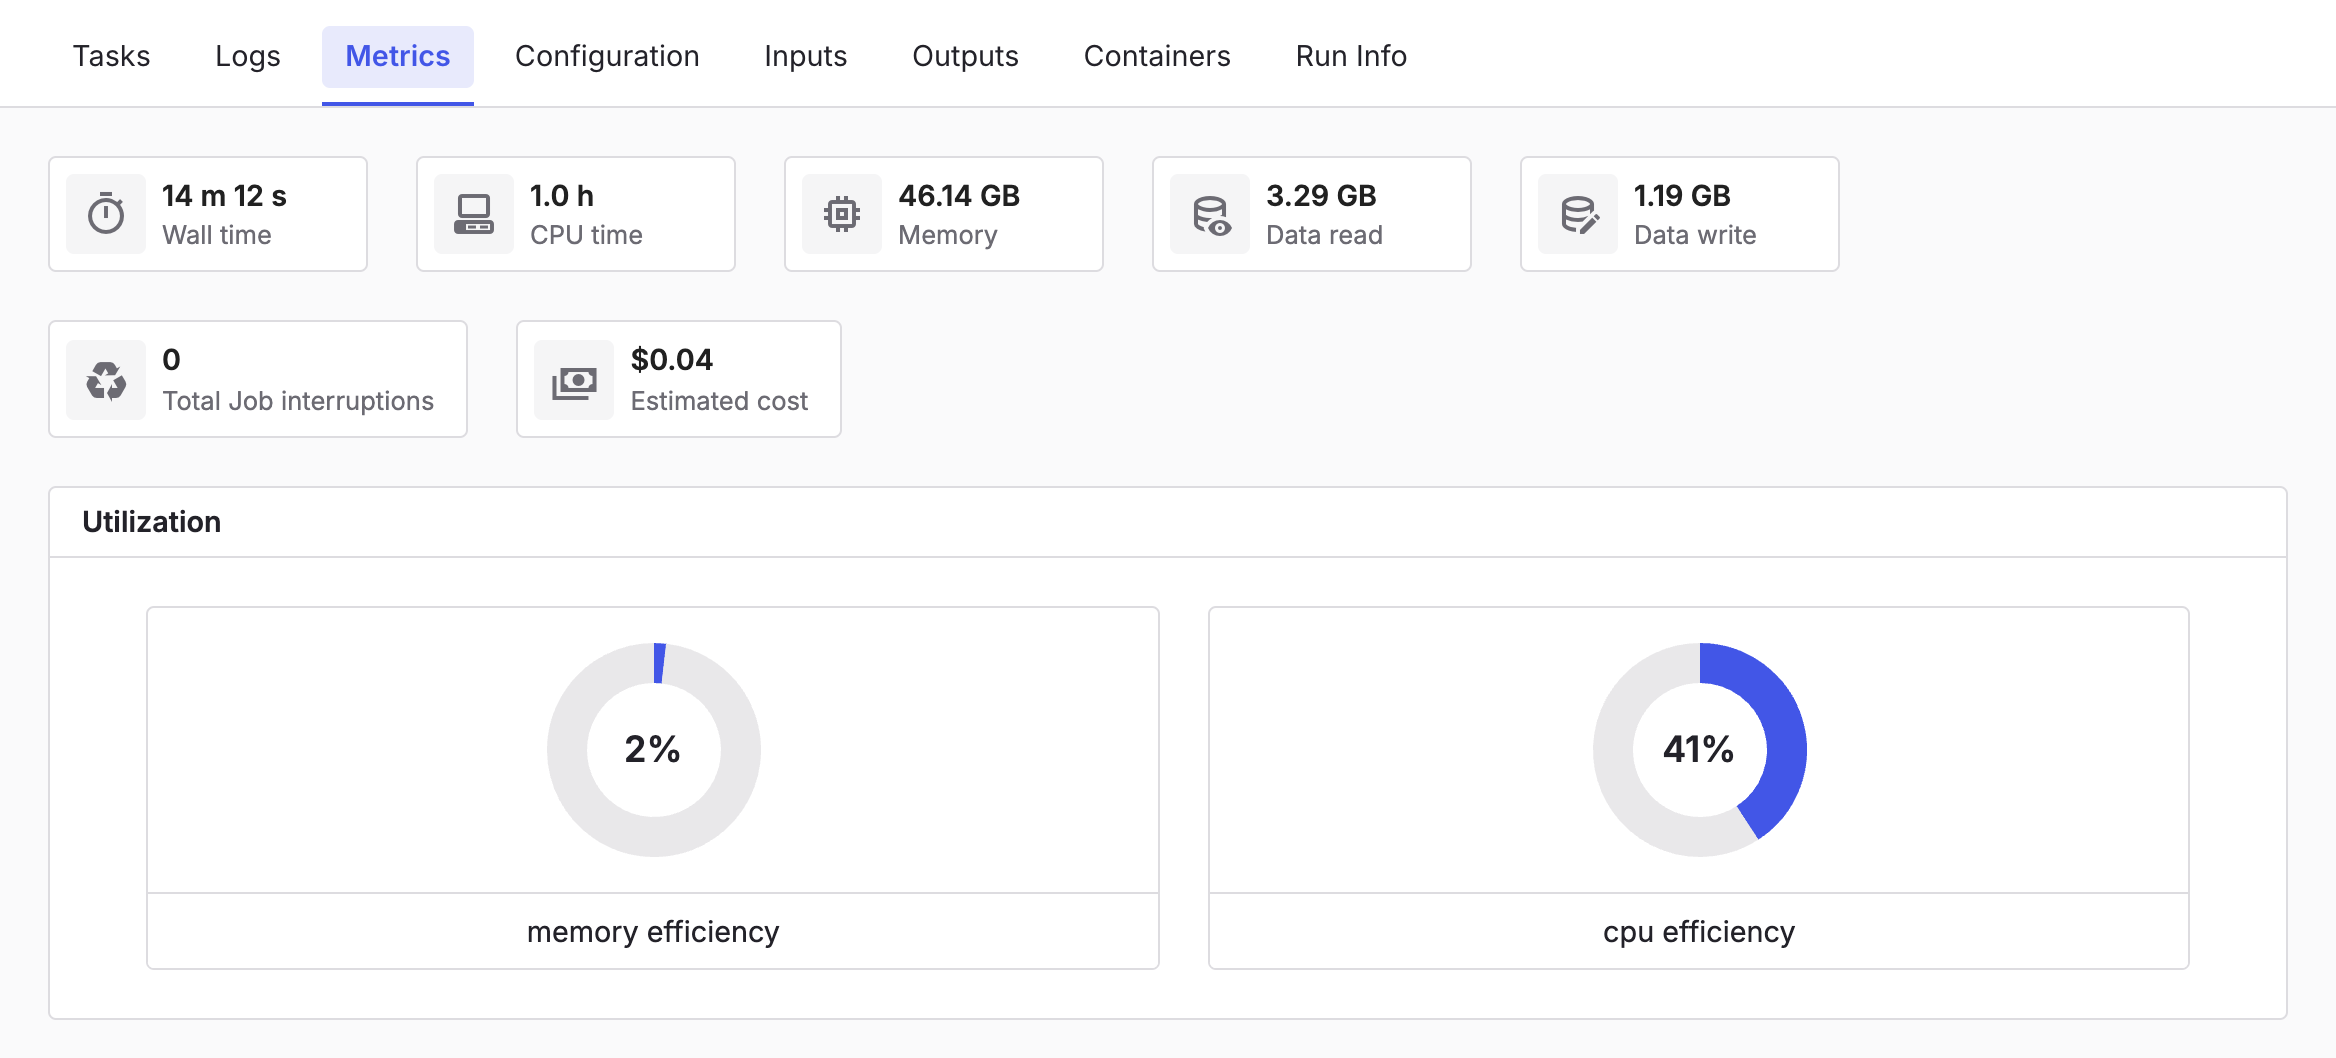
The Metrics tab summarizes the resources the run used. It shows the total wall time, CPU time, memory, data read and written, job interruptions, and the estimated cost.
The Utilization section shows the run's memory and CPU efficiency. The CPU, Memory, Job Duration, and I/O charts below it plot resource usage.
Configuration
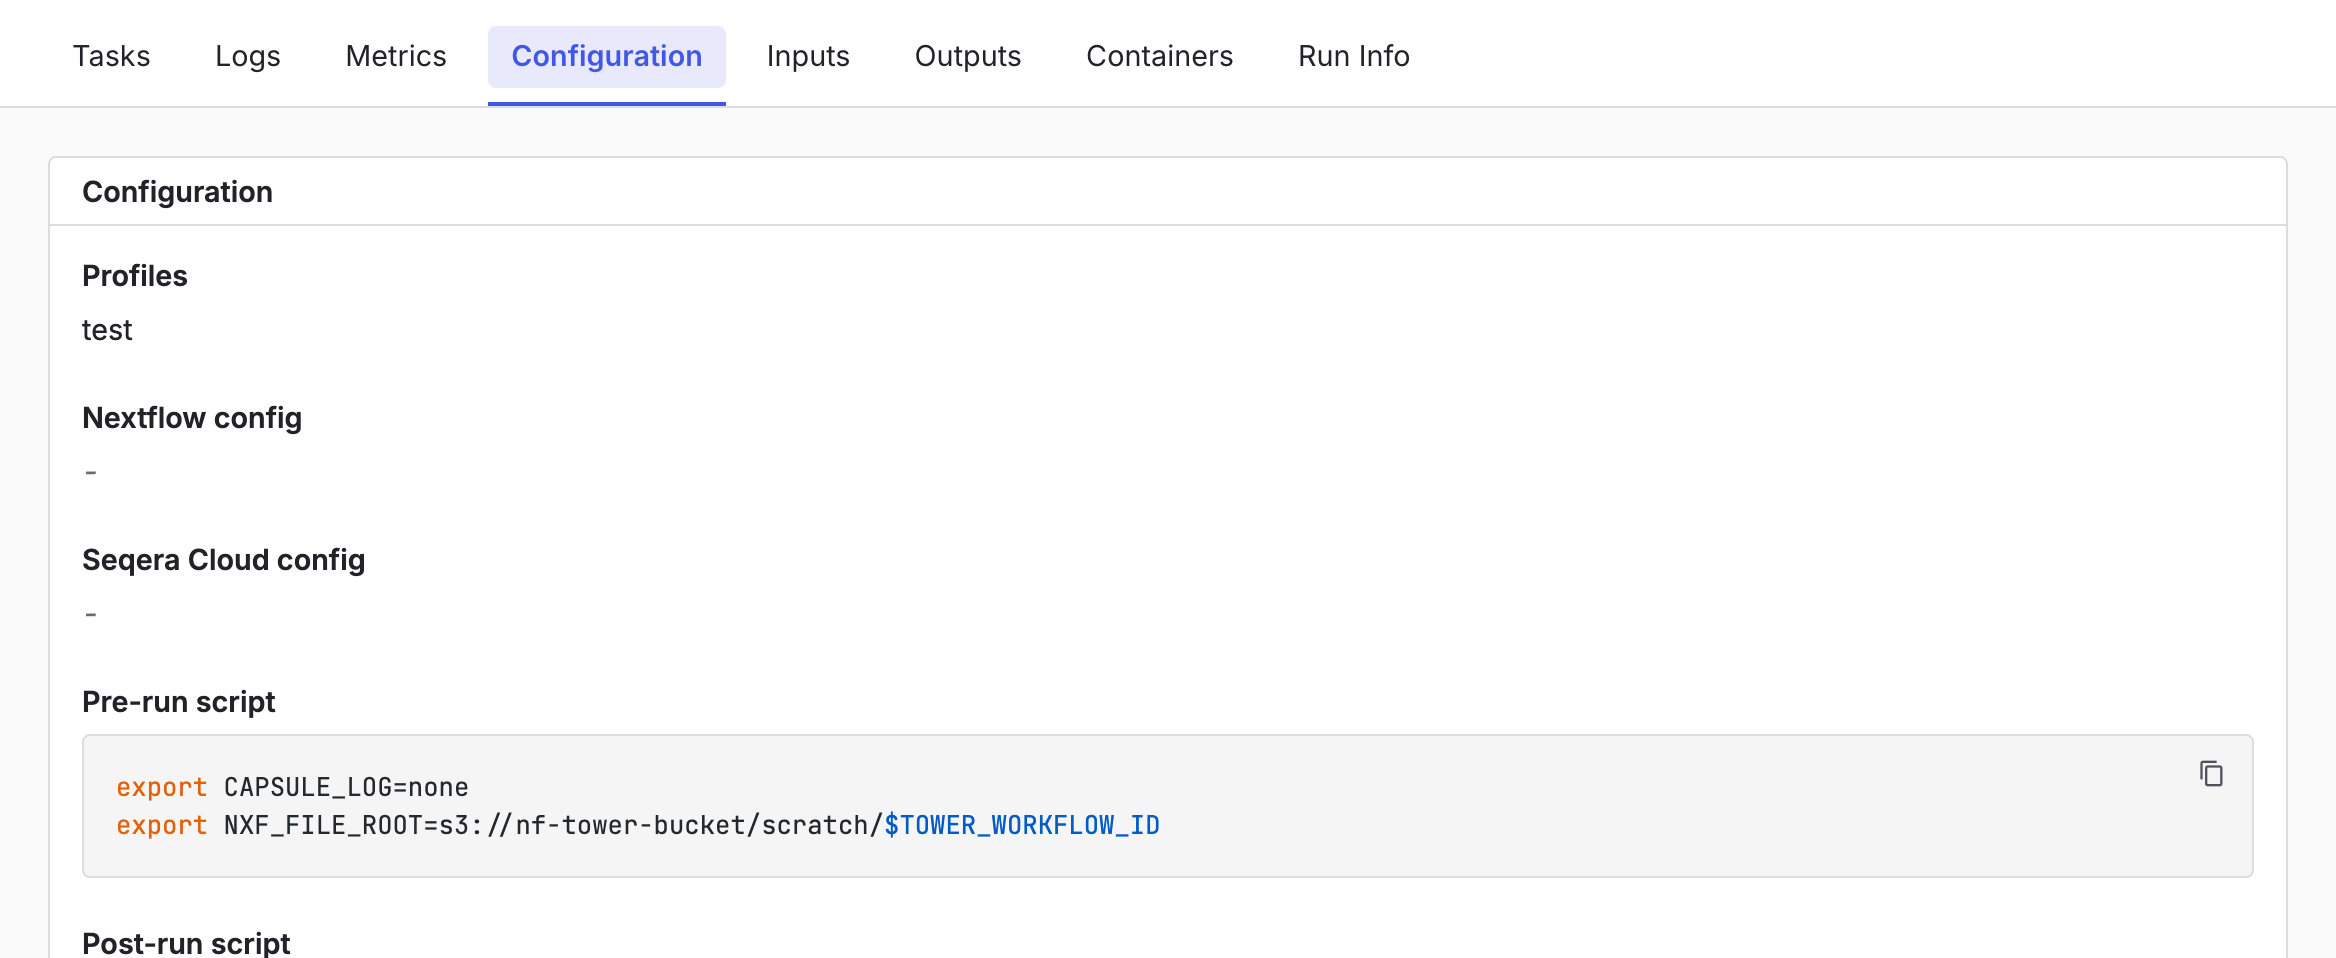
The Configuration tab shows the settings Nextflow used for the run. These include the config profiles, Nextflow and Seqera Cloud config, pre-run and post-run scripts, Nextflow version, syntax parser, launch command, and resolved configuration.
Inputs
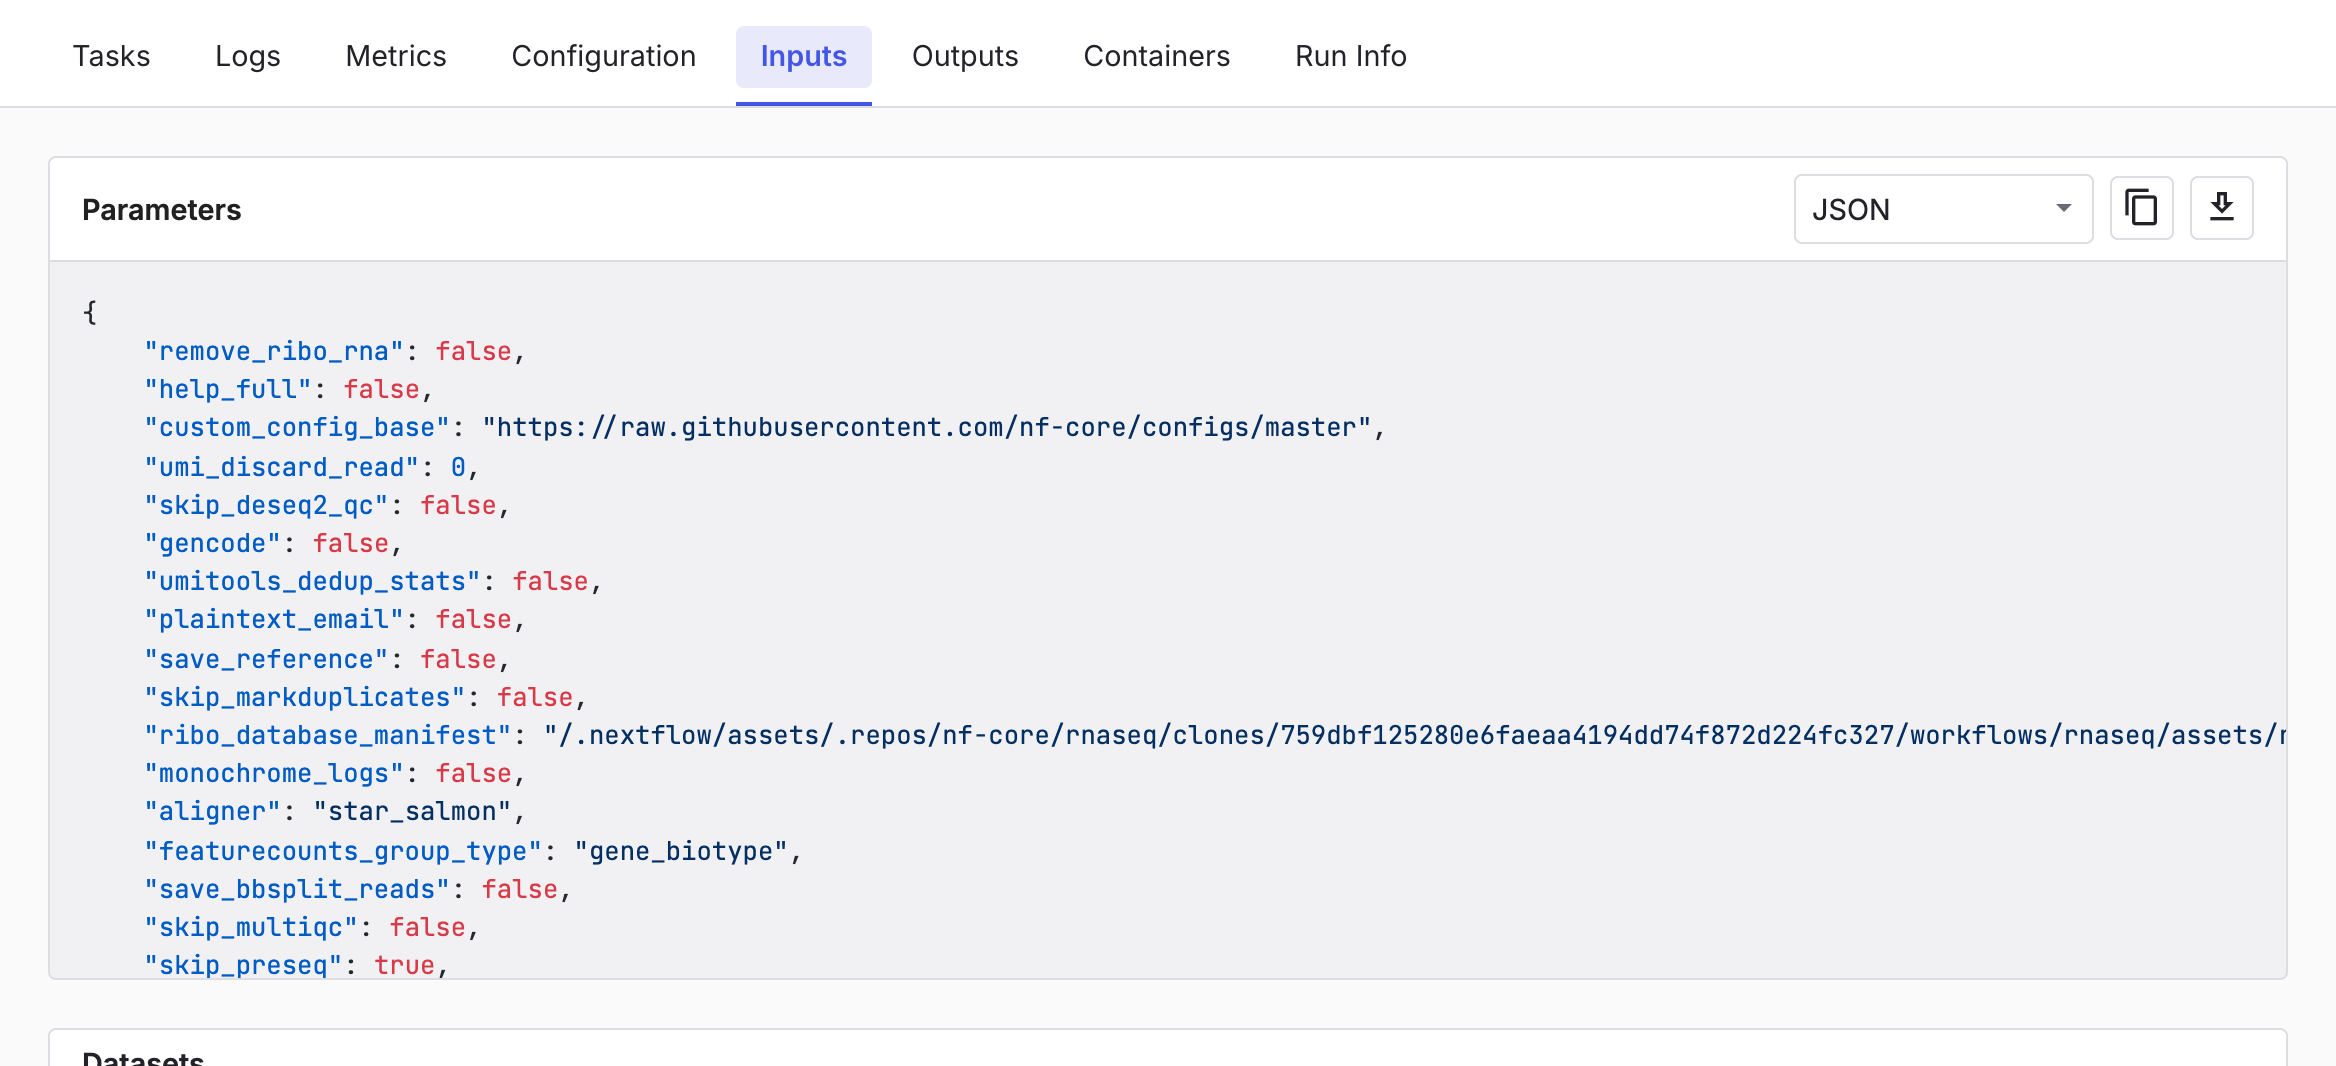
The Inputs tab shows the parameters the run used, in JSON or YAML. Copy or download them to reproduce the run. The tab also lists any datasets the run used.
Outputs
The Outputs tab shows the run's pipeline outputs and reports. Pipeline outputs lists the files the run published when it sets an output directory.
Most Nextflow pipelines generate reports at the end of a run. Reports often contain quality control (QC) metrics that show whether the results are sound. The Reports section lists each report with its kind, size, and cloud storage path.
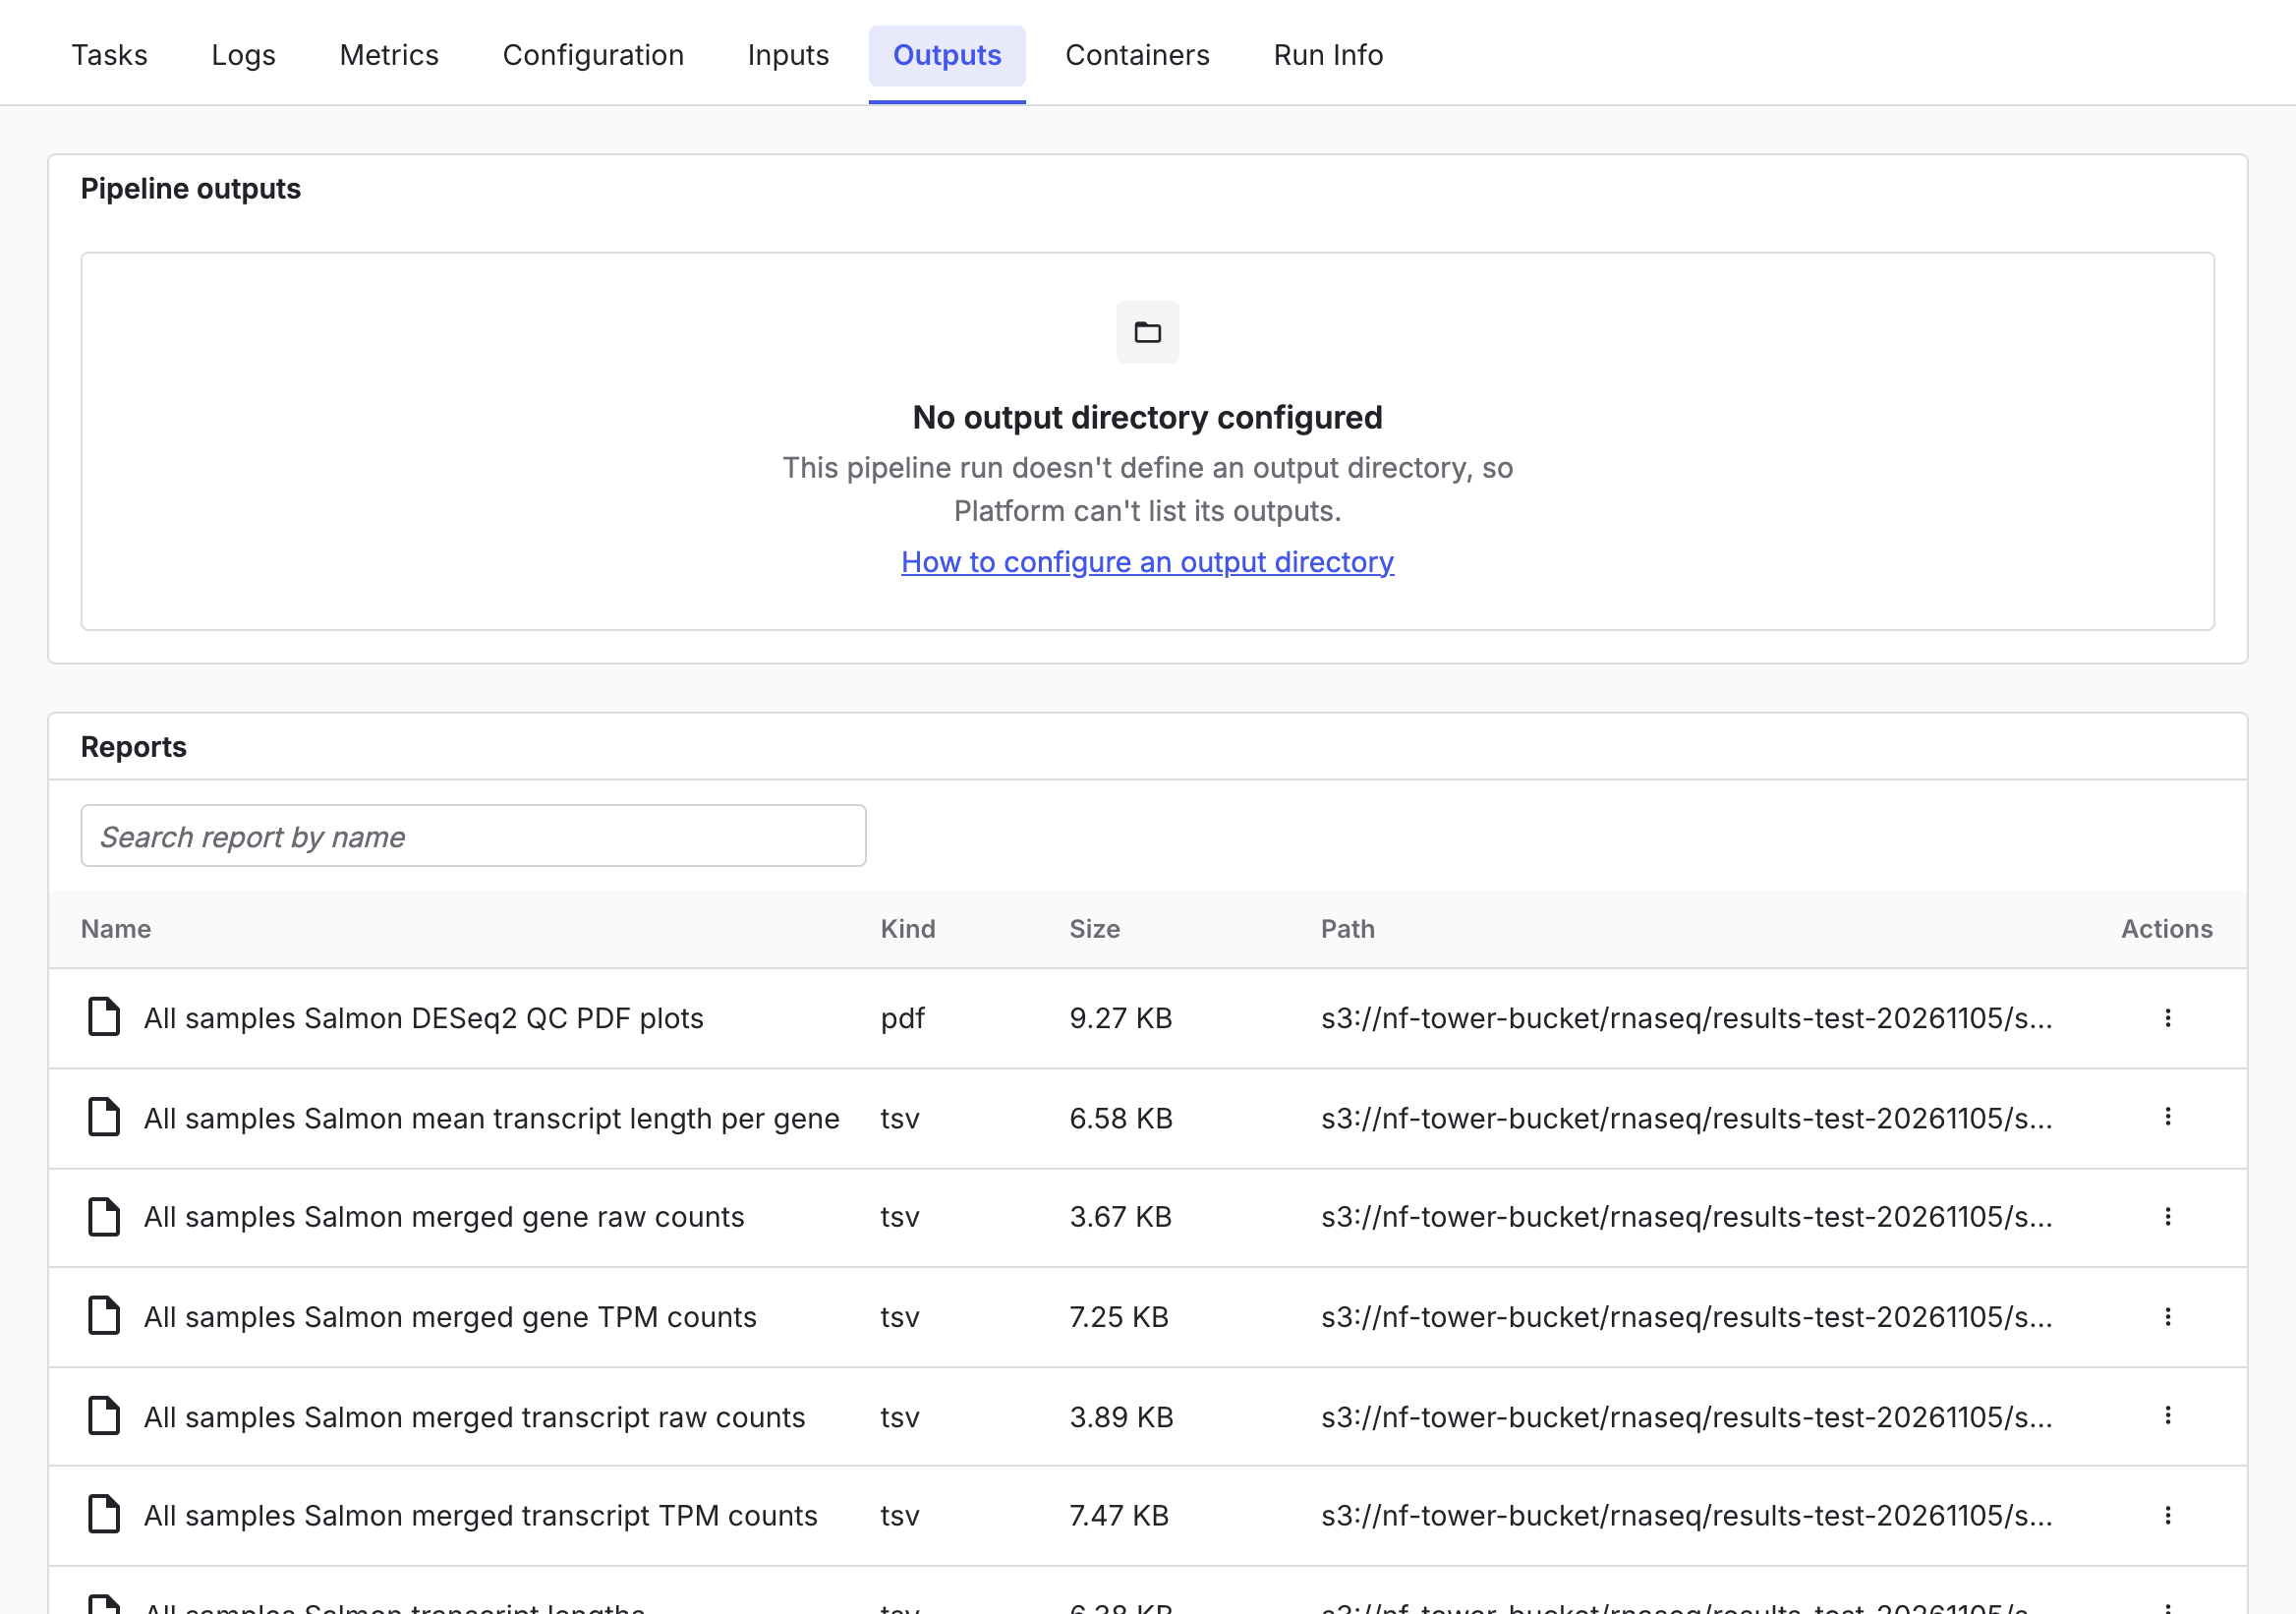
Select a report to preview it in Platform. For example, select the MultiQC report that nf-core/rnaseq generates. MultiQC aggregates statistics and summaries from bioinformatics tools.
Reports live in cloud storage, in the outdir directory you specified at launch. View or download each report from Platform, without opening the cloud console or a remote filesystem.
See Reports to configure reports for pipeline runs in your own workspace.
Containers
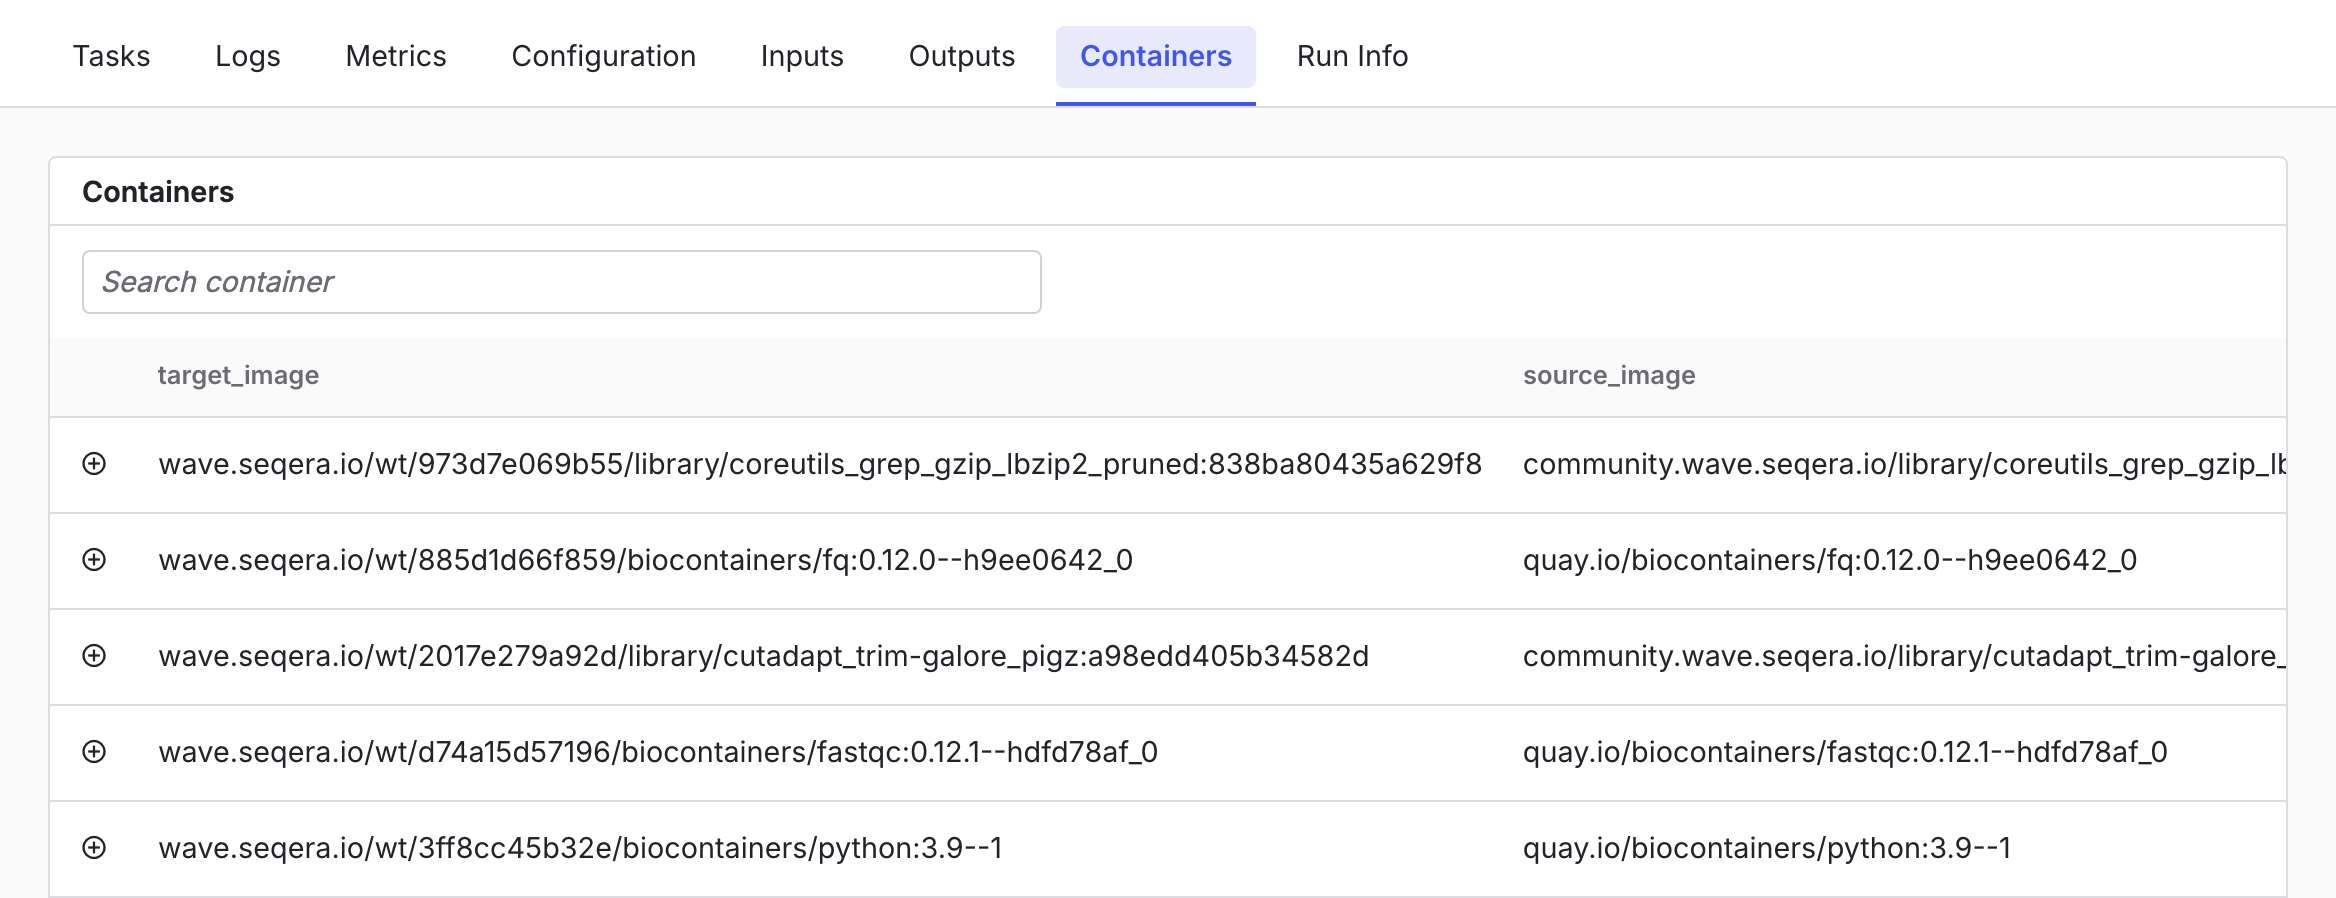
The Containers tab lists the containers Wave provisioned for the run, with each container's target image and source image. Search the list to find a container.
Run Info
The Run Info tab shows who launched the run and when, which pipeline version and commit it used, and where it ran.
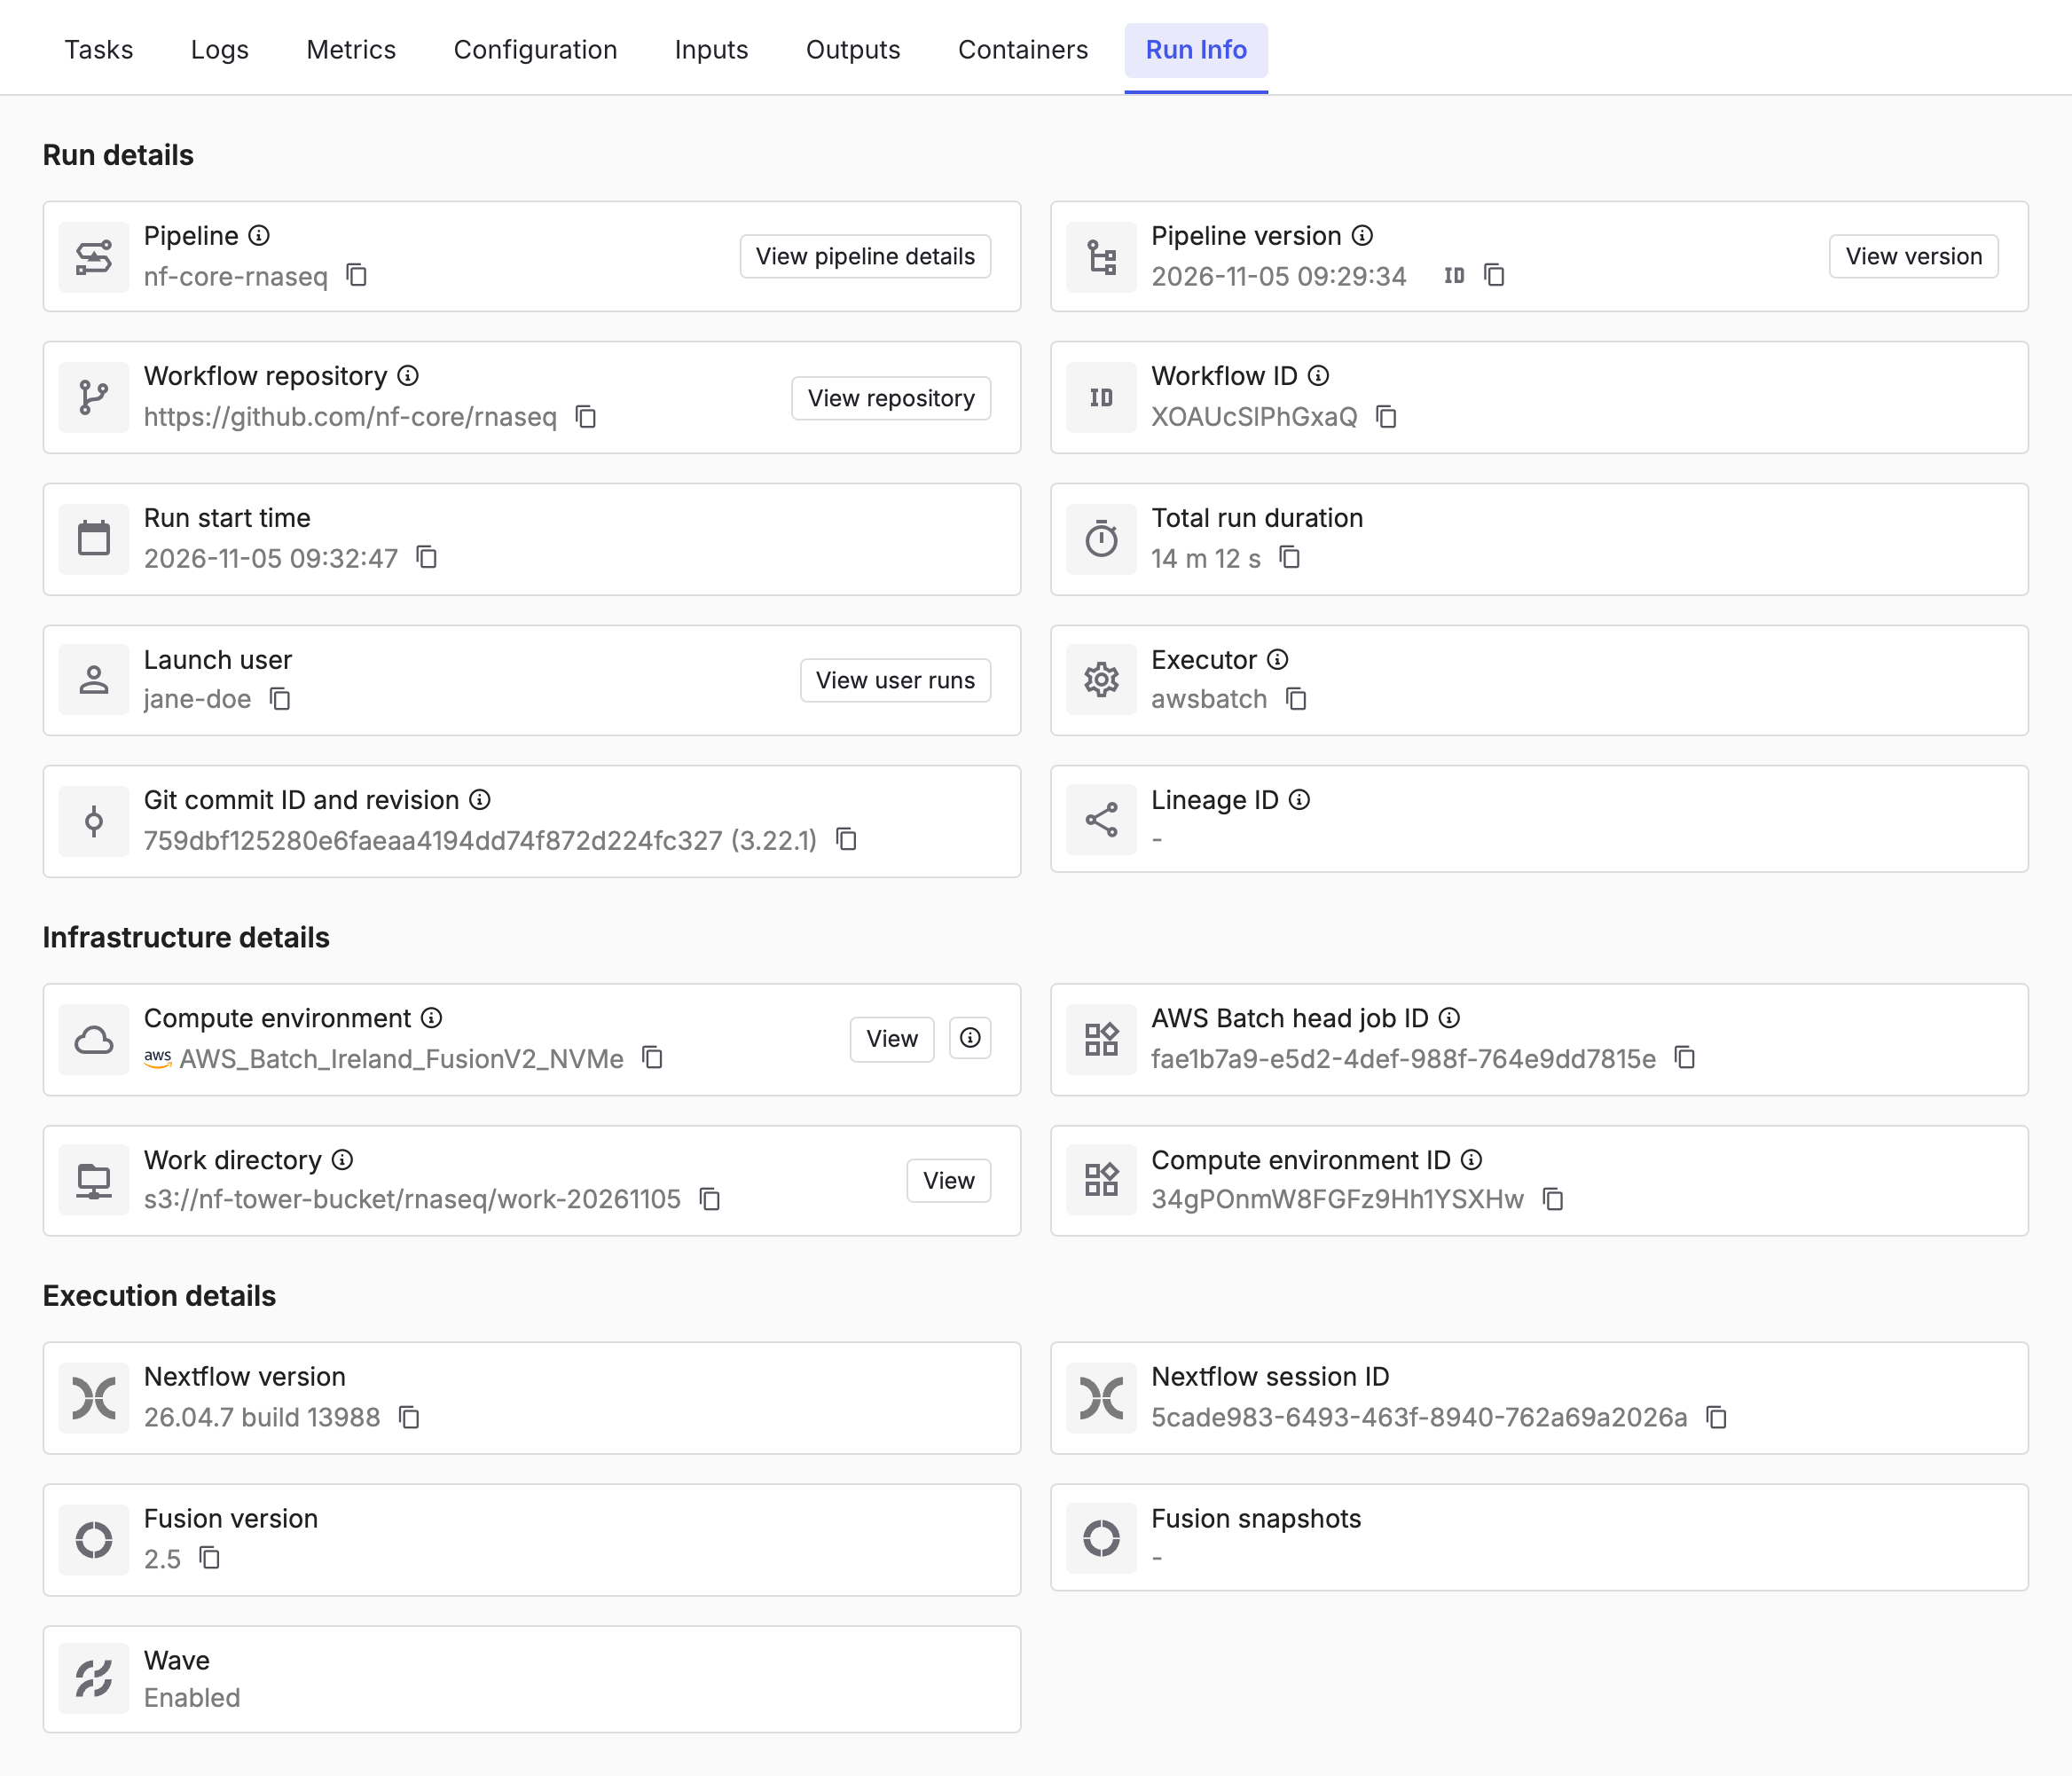
The tab has three sections:
- Run details: The pipeline and pipeline version, workflow repository, workflow ID, run start time and total duration, launch user, executor, Git commit ID and revision, and lineage ID.
- Infrastructure details: The compute environment and its ID, the work directory, and the AWS Batch head job ID.
- Execution details: The Nextflow version and session ID, the Fusion version and Fusion snapshots setting, and whether Wave is enabled.